Calculating Standard Deviation in Python
When we're presented with numerical data, we often find descriptive statistics to better understand it. One of these statistics is called the standard deviation, which measures the spread of our data around the mean (average).
Calculating standard deviation by hand can be tedious, so people often choose to simplify the process with Python. However, there might be some bumps in the road! This guide will demonstrate the different ways to calculate standard deviation in Python so you can choose the method you need.
List of Numbers
To calculate standard deviation, we'll need a list of numbers to work with. Here's a bunch of randomly chosen integers, organized in ascending order:
The Two Types of Standard Deviation
If you've taken a basic statistics class, you've probably seen this formula for standard deviation:
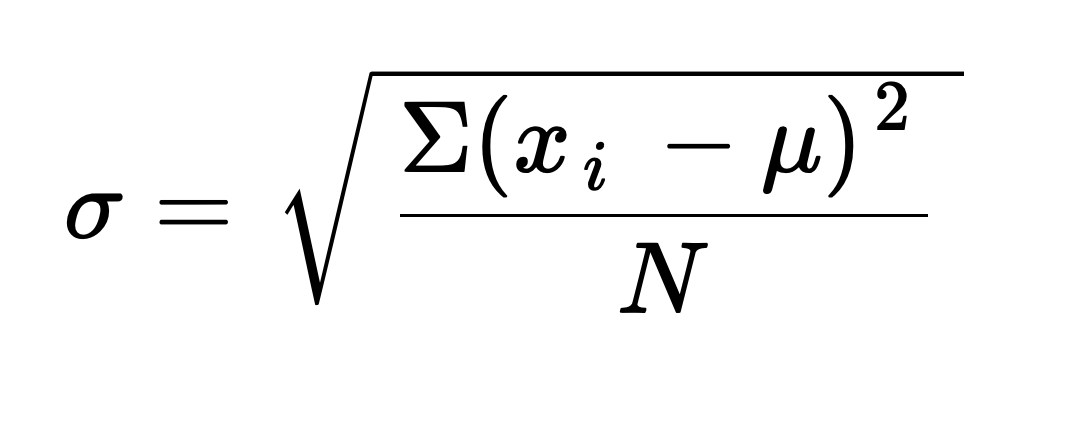
Where:
- xi is each entry
- mu is the mean
- N is the number of entries you're working with
More specifically, this formula is the population standard deviation, one of the two types of standard deviation. We use this formula when we include all values in the entire set in our calculation — in other words, the whole population.
However, there's another version called the sample standard deviation!
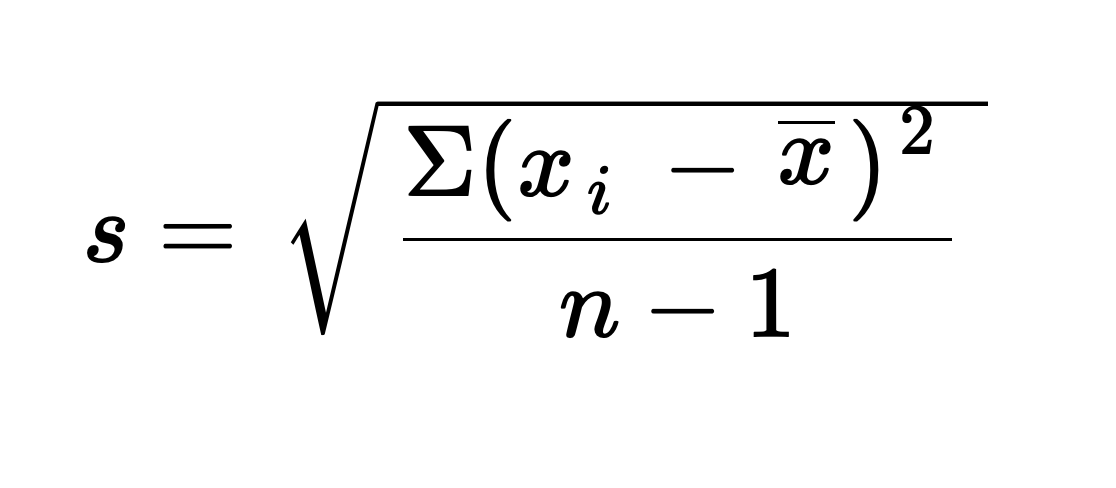
This formula is used when we include only a portion of the entire population in our calculation — in other words, a representative sample. The main difference is the denominator; for sample standard deviation, we subtract 1 from the number of entries in our sample.
The correct formula to use depends entirely on the data in question. Here, since we're working with a finite list of numbers, we'll use the population standard deviation.
Hand Calculations vs. Pandas vs. NumPy
By Hand
Before we calculate the standard deviation with Python, let's calculate it by hand.
- First, find the mean of the list:
(1 + 5 + 8 + 12 + 12 + 13 + 19 + 28)=12.25
- Find the difference between each entry and the mean and square each result:
(1 - 12.25)^2=126.5625(5 - 12.25)^2=52.5625(8 - 12.25)^2=18.0625(12 - 12.25)^2=0.0625(12 - 12.25)^2=0.0625(13 - 12.25)^2=0.5625(19 - 12.25)^2=45.5625(28 - 12.25)^2=248.0625
- Find the sum of all the squared differences:
126.5625+52.5625+18.0625+0.0625+0.0625+0.5625+45.5625+248.0625=491.5
- Divide the sum by
n, the number of entries in the list:491.5/8=61.4375
- Finally, take the square root!
(61.4375)^0.5=7.838, rounded to the third decimal place.
By hand, we've calculated a standard deviation of about 7.838. That was kind of a pain! As usual, Python is much more convenient. Let's calculate the standard devation with Pandas!
Pandas
To have full autonomy with our list of numbers in Pandas, let's put it in a small DataFrame:
| 0 | |
|---|---|
| 0 | 1 |
| 1 | 5 |
| 2 | 8 |
| 3 | 12 |
| 4 | 12 |
| 5 | 13 |
| 6 | 19 |
| 7 | 28 |
From here, calculating the standard deviation is as simple as applying .std() to our DataFrame, as seen in Finding Descriptive Statistics for Columns in a DataFrame:
0    8.379397
dtype: float64
But wait — this isn't the same as our hand-calculated standard deviation! Did we make a mistake? Is Pandas confused? Let's see what NumPy has to say.
NumPy
In NumPy, we calculate standard deviation with a function called np.std() and input our list of numbers as a parameter:
7.838207703295441
That's a relief! This exactly matches the standard deviation we calculated by hand. So what happened?
Pandas calculates the sample standard deviation by default. Most people don't know this — especially DISCOVERY students, who are primarily taught to use Pandas. This error can severely affect statistical calculations.
NumPy calculates the population standard deviation by default, as we discovered. However, there are ways to keep our work within a single library.
Calculating Population Standard Deviation in Pandas
If you don't want to import an entire library just to find the population standard deviation, we can manipulate the pandas .std() function using parameters.
To change the denominator of our standard deviation back to plain old n, set the parameter ddof to 0 in the parenthesis of the function. This stands for delta degrees of freedom, and will make sure we subtract 0 from n.
0    7.838208
dtype: float64
This matches both our hand-calculated and NumPy answers — we now have the population standard deviation.
Calculating Sample Standard Deviation in NumPy
Similarly, you can alter the np.std() function find the sample standard deviation with the NumPy library. The parameter is the exact same — except this time, we set ddof equal to 1 to ensure we subtract 1 from n on the denominator.
8.379396500601086
As you can see, this is the same as our original Pandas answer, meaning we've calculated the sample standard deviation.