Creating a DataFrame from an Excel file using Pandas
Many datasets are provided in an Excel file format (file extension .xlsx). The pd.read_excel function provides two primary ways to read an Excel file.
Reading an Excel file with a single sheet
By default, pd.read_excel file will always read the first sheet in an Excel file into a DataFrame. This means an Excel file with only a single sheet is easily read. The next section, "Reading in an Excel file with multiple sheets", guides you through reading all of the sheets in one Excel file.
Reading in an Excel file from a URL
Sometimes, as with many publicly available datasets, we can use the URL of the dataset. One example of this is a dataset used to document digital equity in the U.S. This dataset includes information on high-speed internet availability in the United States, provided by the U.S. Census. You can find the dataset here.
To load this dataset, input the URL as a string to the read_excel function.
import pandas as pd
df = pd.read_excel("https://www2.census.gov/programs-surveys/demo/datasets/community-resilience/state_total_covered_populations.xlsx")
| st | statename | state_tot_pop | tot_cov_pop | ... | pct_no_pc_tablet_ntia_MOE | |
|---|---|---|---|---|---|---|
| 0 | 1 | Alabama | 4903185 | 4261000 | ... | 2.2 |
| 1 | 2 | Alaska | 731545 | 603000 | ... | 2.8 |
| 2 | 4 | Arizona | 7278717 | 5808000 | ... | 3.0 |
| 3 | 5 | Arkansas | 3017804 | 2637000 | ... | 2.9 |
| 4 | 6 | California | 39512223 | 33560000 | ... | 1.2 |
| 5 | 8 | Colorado | 5758736 | 4142000 | ... | 3.4 |
| ... | ... | ... | ... | ... | ... | |
| 51 | 72 | Puerto Rico | 3193694 | 3186000 | ... | NaN |
Reading in an Excel file from your local computer
Now, let's learn how to read in an Excel file from your computer. In this example, we will use a dataset provided by the World Bank, that shows the annual GDP in every country each year (in USD), starting in 1970. The dataset can be found here.
To read in an Excel file from your computer:
- Make sure the Excel file is in the same folder as the python file you are working with.
- Specify the file name as a string into the
read_excelfunction.
import pandas as pd
df = pd.read_excel("global-gdp-1970-2020.xls")
| Country Name | Country Code | Indicator Name | 1960 | 1961 | 1962 | ... | 2021 | |
|---|---|---|---|---|---|---|---|---|
| 0 | Aruba | ABW | GDP (current US$) | NaN | NaN | NaN | ... | 3.202189e+09 |
| 1 | Africa Eastern and Southern | AFE | GDP (current US$) | 2.008272e+10 | 2.050945e+10 | 2.235043e+10 | ... | 9.207923e+11 |
| 2 | Afghanistan | AFG | GDP (current US$) | 5.377778e+08 | 5.488889e+08 | 5.466667e+08 | ... | NaN |
| 3 | Africa Western and Central | AFW | GDP (current US$) | 1.040428e+10 | 1.112805e+10 | 1.194335e+10 | ... | 7.845876e+11 |
| 4 | Angola | AGO | GDP (current US$) | NaN | NaN | NaN | ... | 5.837598e+10 |
| ... | ... | ... | ... | ... | ... | ... | ... | ... |
| 265 | Zimbabwe | ZWE | GDP (current US$) | 1.052990e+09 | 1.096647e+09 | 1.117602e+09 | ... | 1.928429e+10 |
Reading in an Excel file with multiple sheets
If the excel file you want to read in has multiple tabs or multiple sheets, you can load each sheet in as a separate DataFrame by including the sheet_name as an additional input. This can either be done with the names of the sheets or with the index of the sheet (sheet 0, 1, 2, etc.)
An Excel dataset with multiple sheets
For example, we will use the file state_total_covered_populations.xslx, which is a dataset provided by the U.S. Census Bureau that gives nationwide statistics about the availability of high-speed internet in each state.
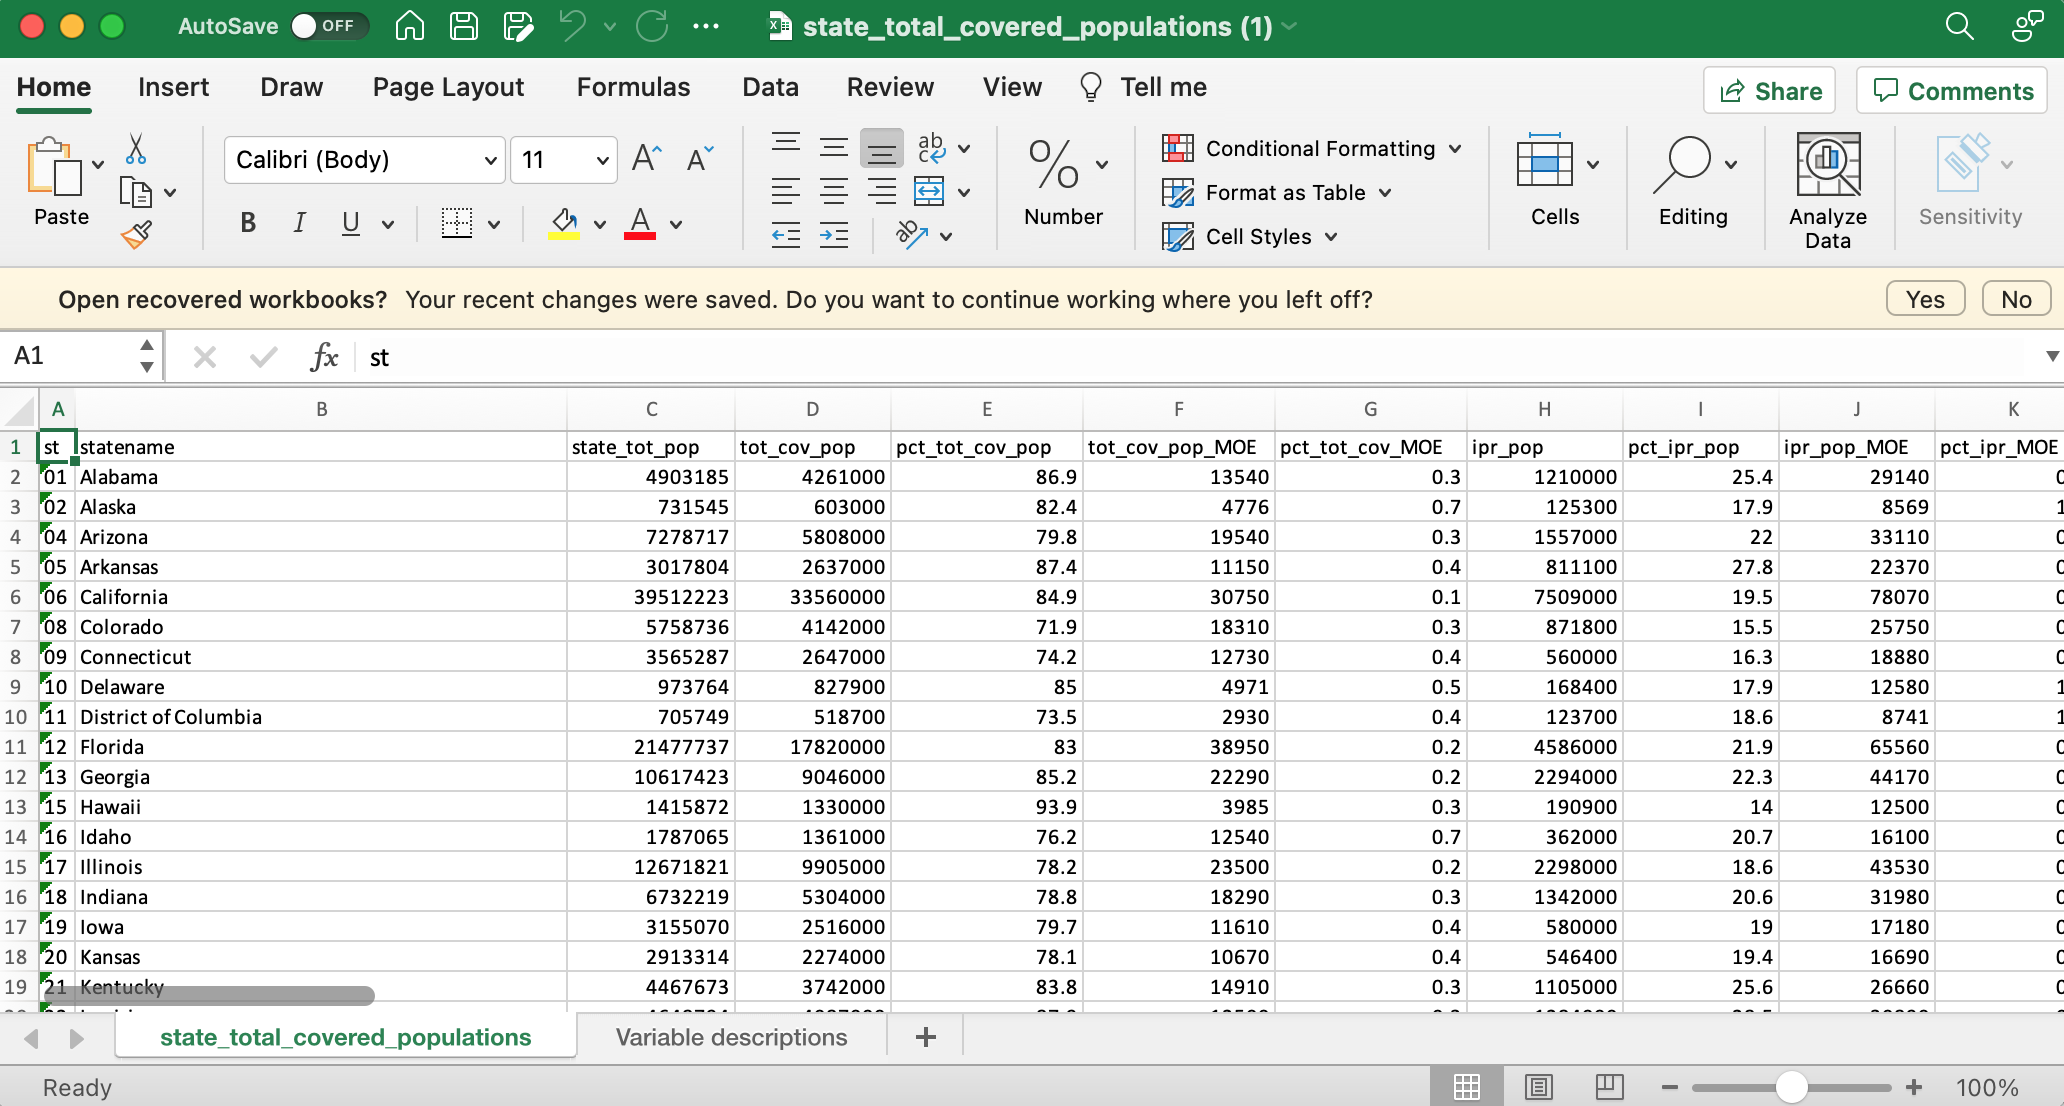
This dataset comes with multiple sheets, state_total_covered_populations, and Variable Descriptions. We want to load in the first and second sheets as their own DataFrames.
Loading multiple sheets by the index
First we will load them using the order (index) of the sheets.
import pandas as pd
df1 = pd.read_excel("state_total_covered_populations.xslx", sheet_name=0)
df2 =  pd.read_excel("state_total_covered_populations.xslx", sheet_name=1)
df1
| st | statename | state_tot_pop | tot_cov_pop | pct_tot_cov_pop | tot_cov_pop_MOE | pct_tot_cov_MOE | ipr_pop | pct_ipr_pop | ipr_pop_MOE | ... | pct_rural_MOE | pct_no_fixed_bb_pop_fcc | no_bb_or_computer_pop | pct_no_bb_or_computer_pop | no_bb_or_computer_pop_MOE | pct_no_bb_or_computer_MOE | pct_not_inter_user_pop_ntia | pct_not_inter_user_ntia_MOE | pct_no_pc_tablet_pop_ntia | pct_no_pc_tablet_ntia_MOE | |
|---|---|---|---|---|---|---|---|---|---|---|---|---|---|---|---|---|---|---|---|---|---|
| 0 | 1 | Alabama | 4903185 | 4261000 | 86.9 | 13540 | 0.3 | 1210000 | 25.4 | 29140 | ... | 0.4 | 12.4 | 714086 | 14.9 | 21655 | 0.5 | 21.7 | 2.7 | 38.8 | 2.2 |
| 1 | 2 | Alaska | 731545 | 603000 | 82.4 | 4776 | 0.7 | 125300 | 17.9 | 8569 | ... | 0.5 | 14.8 | 65852 | 9.3 | 5630 | 0.8 | 17.7 | 2.6 | 29.9 | 2.8 |
| 2 | 4 | Arizona | 7278717 | 5808000 | 79.8 | 19540 | 0.3 | 1557000 | 22.0 | 33110 | ... | 0.2 | 5.2 | 788293 | 11.1 | 29081 | 0.4 | 21.1 | 2.9 | 38.2 | 3.0 |
| 3 | 5 | Arkansas | 3017804 | 2637000 | 87.4 | 11150 | 0.4 | 811100 | 27.8 | 22370 | ... | 0.4 | 19.0 | 467370 | 15.9 | 18153 | 0.6 | 18.2 | 2.3 | 37.8 | 2.9 |
| 4 | 6 | California | 39512223 | 33560000 | 84.9 | 30750 | 0.1 | 7509000 | 19.5 | 78070 | ... | 0.1 | 1.5 | 3062449 | 7.9 | 52570 | 0.1 | 18.8 | 1.1 | 32.8 | 1.2 |
| 5 | 8 | Colorado | 5758736 | 4142000 | 71.9 | 18310 | 0.3 | 871800 | 15.5 | 25750 | ... | 0.2 | 2.8 | 374151 | 6.6 | 17488 | 0.3 | 14.6 | 2.7 | 28.7 | 3.4 |
| 6 | 9 | Connecticut | 3565287 | 2647000 | 74.2 | 12730 | 0.4 | 560000 | 16.3 | 18880 | ... | 0.3 | 0.8 | 279524 | 8.1 | 17594 | 0.5 | 22.8 | 4.1 | 33.2 | 4.5 |
| 7 | 10 | Delaware | 973764 | 827900 | 85.0 | 4971 | 0.5 | 168400 | 17.9 | 12580 | ... | 0.5 | 2.2 | 89025 | 9.4 | 8577 | 0.9 | 18.3 | 2.9 | 33.7 | 3.0 |
| 8 | 11 | District of Columbia | 705749 | 518700 | 73.5 | 2930 | 0.4 | 123700 | 18.6 | 8741 | ... | ***** | 2.0 | 71696 | 10.8 | 7904 | 1.2 | 14.2 | 2.5 | 24.2 | 2.9 |
| 9 | 12 | Florida | 21477737 | 17820000 | 83.0 | 38950 | 0.2 | 4586000 | 21.9 | 65560 | ... | 0.2 | 3.7 | 2257431 | 10.7 | 59851 | 0.3 | 25.4 | 1.8 | 40.0 | 2.0 |
| 10 | 13 | Georgia | 10617423 | 9046000 | 85.2 | 22290 | 0.2 | 2294000 | 22.3 | 44170 | ... | 0.2 | 6.2 | 1272071 | 12.3 | 40855 | 0.4 | 18.8 | 2.6 | 33.6 | 3.4 |
| 11 | 15 | Hawaii | 1415872 | 1330000 | 93.9 | 3985 | 0.3 | 190900 | 14.0 | 12500 | ... | 0.7 | 2.1 | 119595 | 8.7 | 10028 | 0.7 | 20.8 | 3.3 | 36.8 | 3.6 |
| 12 | 16 | Idaho | 1787065 | 1361000 | 76.2 | 12540 | 0.7 | 362000 | 20.7 | 16100 | ... | 0.5 | 4.7 | 149117 | 8.5 | 11854 | 0.7 | 11.4 | 1.8 | 27.0 | 2.6 |
| 13 | 17 | Illinois | 12671821 | 9905000 | 78.2 | 23500 | 0.2 | 2298000 | 18.6 | 43530 | ... | 0.1 | 2.0 | 1258766 | 10.2 | 29849 | 0.2 | 12.2 | 1.6 | 26.3 | 1.7 |
| 14 | 18 | Indiana | 6732219 | 5304000 | 78.8 | 18290 | 0.3 | 1342000 | 20.6 | 31980 | ... | 0.2 | 3.9 | 825338 | 12.6 | 24022 | 0.4 | 17.0 | 3.5 | 32.9 | 3.0 |
| 15 | 19 | Iowa | 3155070 | 2516000 | 79.7 | 11610 | 0.4 | 580000 | 19.0 | 17180 | ... | 0.4 | 4.0 | 364979 | 11.9 | 15491 | 0.5 | 14.3 | 3.9 | 29.7 | 3.6 |
| 16 | 20 | Kansas | 2913314 | 2274000 | 78.1 | 10670 | 0.4 | 546400 | 19.4 | 16690 | ... | 0.3 | 4.3 | 311209 | 11.0 | 15763 | 0.6 | 15.9 | 3.1 | 31.5 | 3.8 |
| 17 | 21 | Kentucky | 4467673 | 3742000 | 83.8 | 14910 | 0.3 | 1105000 | 25.6 | 26660 | ... | 0.3 | 5.7 | 563191 | 13.0 | 20612 | 0.5 | 19.0 | 4.4 | 37.1 | 4.7 |
| 18 | 22 | Louisiana | 4648794 | 4087000 | 87.9 | 12500 | 0.3 | 1284000 | 28.5 | 30890 | ... | 0.4 | 11.6 | 708799 | 15.7 | 21704 | 0.5 | 17.1 | 2.5 | 38.1 | 3.6 |
| 19 | 23 | Maine | 1344212 | 1196000 | 89.0 | 7398 | 0.6 | 239500 | 18.5 | 11840 | ... | 0.6 | 3.5 | 149709 | 11.5 | 9033 | 0.7 | 14.6 | 2.9 | 25.8 | 3.3 |
| 20 | 24 | Maryland | 6045680 | 5017000 | 83.0 | 13200 | 0.2 | 847200 | 14.4 | 27380 | ... | 0.2 | 2.5 | 504996 | 8.6 | 24626 | 0.4 | 17.5 | 2.9 | 32.6 | 3.1 |
| 21 | 25 | Massachusetts | 6892503 | 4727000 | 68.6 | 18990 | 0.3 | 980100 | 14.8 | 23900 | ... | 0.2 | 2.0 | 530525 | 8.0 | 18971 | 0.3 | 19.5 | 2.1 | 30.5 | 2.5 |
| 22 | 26 | Michigan | 9986857 | 8051000 | 80.6 | 22790 | 0.2 | 2032000 | 20.9 | 33170 | ... | 0.2 | 4.2 | 1032538 | 10.6 | 25365 | 0.3 | 18.5 | 2.4 | 31.9 | 2.9 |
| 23 | 27 | Minnesota | 5639632 | 4168000 | 73.9 | 16240 | 0.3 | 819600 | 14.9 | 20460 | ... | 0.2 | 2.5 | 461115 | 8.4 | 15395 | 0.3 | 13.2 | 2.5 | 23.6 | 3.1 |
| 24 | 28 | Mississippi | 2976149 | 2754000 | 92.5 | 10090 | 0.3 | 893400 | 31.1 | 28030 | ... | 0.4 | 19.7 | 535054 | 18.6 | 18099 | 0.6 | 21.9 | 2.7 | 40.7 | 2.8 |
| 25 | 29 | Missouri | 6137428 | 4858000 | 79.2 | 14730 | 0.2 | 1276000 | 21.5 | 27350 | ... | 0.2 | 6.9 | 695984 | 11.7 | 18843 | 0.3 | 18.0 | 2.5 | 32.5 | 3.8 |
| 26 | 30 | Montana | 1068778 | 890500 | 83.3 | 6458 | 0.6 | 215000 | 20.8 | 10150 | ... | 0.5 | 13.3 | 113980 | 11.0 | 6659 | 0.6 | 20.2 | 2.4 | 29.5 | 2.9 |
| 27 | 31 | Nebraska | 1934408 | 1446000 | 74.8 | 9353 | 0.5 | 339400 | 18.1 | 13070 | ... | 0.3 | 3.7 | 167216 | 8.9 | 7492 | 0.4 | 18.6 | 2.8 | 30.0 | 2.5 |
| 28 | 32 | Nevada | 3080156 | 2533000 | 82.2 | 11110 | 0.4 | 626100 | 20.7 | 23210 | ... | 0.3 | 2.9 | 360050 | 11.8 | 21334 | 0.7 | 27.5 | 2.9 | 39.1 | 3.0 |
| 29 | 33 | New Hampshire | 1359711 | 1071000 | 78.8 | 8908 | 0.7 | 162100 | 12.3 | 10370 | ... | 0.6 | 3.2 | 99795 | 7.6 | 7257 | 0.6 | 15.6 | 2.5 | 24.9 | 2.7 |
| 30 | 34 | New Jersey | 8882190 | 6746000 | 75.9 | 19610 | 0.2 | 1300000 | 15.0 | 31020 | ... | 0.2 | 1.5 | 705327 | 8.1 | 24463 | 0.3 | 14.7 | 2.1 | 29.5 | 2.5 |
| 31 | 35 | New Mexico | 2096829 | 1916000 | 91.4 | 6298 | 0.3 | 585400 | 28.6 | 20230 | ... | 0.5 | 12.9 | 382546 | 18.6 | 15767 | 0.8 | 19.5 | 3.1 | 40.9 | 5.2 |
| 32 | 36 | New York | 19453561 | 15730000 | 80.9 | 23660 | 0.1 | 3722000 | 19.8 | 59940 | ... | 0.1 | 1.3 | 2046080 | 10.8 | 47346 | 0.3 | 23.6 | 1.9 | 34.8 | 1.7 |
| 33 | 37 | North Carolina | 10488084 | 8751000 | 83.4 | 20830 | 0.2 | 2320000 | 22.8 | 41940 | ... | 0.2 | 4.5 | 1215297 | 11.9 | 35405 | 0.3 | 22.0 | 2.4 | 38.0 | 2.7 |
| 34 | 38 | North Dakota | 762062 | 563700 | 74.0 | 6619 | 0.9 | 128500 | 17.5 | 8126 | ... | 0.9 | 3.2 | 88649 | 12.0 | 7731 | 1.0 | 21.6 | 2.4 | 32.0 | 3.2 |
| 35 | 39 | Ohio | 11689100 | 8968000 | 76.7 | 26150 | 0.2 | 2397000 | 21.2 | 38570 | ... | 0.2 | 2.8 | 1266088 | 11.1 | 32895 | 0.3 | 19.6 | 2.1 | 36.1 | 2.5 |
| 36 | 40 | Oklahoma | 3956971 | 3308000 | 83.6 | 12440 | 0.3 | 955600 | 24.9 | 18780 | ... | 0.2 | 12.2 | 495737 | 12.9 | 15547 | 0.4 | 21.3 | 3.1 | 39.7 | 3.6 |
| 37 | 41 | Oregon | 4217737 | 3208000 | 76.1 | 13840 | 0.3 | 772300 | 18.8 | 24830 | ... | 0.4 | 5.1 | 335261 | 8.1 | 16027 | 0.4 | 12.6 | 2.1 | 27.0 | 2.6 |
| 38 | 42 | Pennsylvania | 12801989 | 10160000 | 79.4 | 24730 | 0.2 | 2360000 | 19.1 | 42240 | ... | 0.2 | 4.1 | 1356548 | 11.0 | 28067 | 0.2 | 24.3 | 2.6 | 36.6 | 2.7 |
| 39 | 44 | Rhode Island | 1059361 | 750500 | 70.8 | 8733 | 0.8 | 171200 | 16.9 | 11800 | ... | 0.6 | 1.4 | 89495 | 8.8 | 8769 | 0.9 | 18.2 | 3.4 | 31.0 | 3.5 |
| 40 | 45 | South Carolina | 5148714 | 4380000 | 85.1 | 15790 | 0.3 | 1153000 | 23.1 | 34480 | ... | 0.4 | 8.7 | 720310 | 14.4 | 26065 | 0.5 | 18.7 | 2.1 | 32.3 | 2.4 |
| 41 | 46 | South Dakota | 884659 | 722200 | 81.6 | 5421 | 0.6 | 163000 | 19.3 | 8177 | ... | 0.5 | 5.0 | 104435 | 12.3 | 6172 | 0.7 | 15.4 | 3.1 | 34.2 | 3.5 |
| 42 | 47 | Tennessee | 6829174 | 5604000 | 82.1 | 18770 | 0.3 | 1525000 | 23.0 | 30750 | ... | 0.2 | 6.3 | 895081 | 13.4 | 27605 | 0.4 | 20.9 | 2.0 | 35.9 | 2.6 |
| 43 | 48 | Texas | 28995881 | 24830000 | 85.6 | 36320 | 0.1 | 6547000 | 23.1 | 94340 | ... | 0.1 | 4.2 | 3246038 | 11.4 | 60334 | 0.2 | 23.0 | 1.8 | 40.0 | 1.9 |
| 44 | 49 | Utah | 3205958 | 1969000 | 61.4 | 15460 | 0.5 | 503100 | 16.0 | 18510 | ... | 0.2 | 4.3 | 210086 | 6.7 | 12840 | 0.4 | 15.6 | 3.3 | 27.5 | 3.7 |
| 45 | 50 | Vermont | 623989 | 602700 | 96.6 | 2100 | 0.3 | 105300 | 17.7 | 6385 | ... | 0.1 | 6.9 | 76578 | 12.8 | 6414 | 1.1 | 17.1 | 2.6 | 29.3 | 3.2 |
| 46 | 51 | Virginia | 8535519 | 6925000 | 81.1 | 18230 | 0.2 | 1364000 | 16.5 | 34110 | ... | 0.2 | 5.8 | 836641 | 10.1 | 25001 | 0.3 | 19.5 | 2.4 | 35.2 | 3.2 |
| 47 | 53 | Washington | 7614893 | 5752000 | 75.5 | 22200 | 0.3 | 1196000 | 16.1 | 30080 | ... | 0.3 | 3.7 | 470559 | 6.3 | 19853 | 0.3 | 16.1 | 2.5 | 28.7 | 2.4 |
| 48 | 54 | West Virginia | 1792147 | 1736000 | 96.9 | 4348 | 0.2 | 459100 | 26.5 | 16070 | ... | 0.1 | 17.8 | 252050 | 14.4 | 10619 | 0.6 | 19.8 | 2.2 | 36.9 | 4.4 |
| 49 | 55 | Wisconsin | 5822434 | 4600000 | 79.0 | 15370 | 0.3 | 975800 | 17.2 | 21340 | ... | 0.2 | 6.8 | 589985 | 10.4 | 12196 | 0.2 | 12.2 | 2.5 | 30.3 | 3.5 |
| 50 | 56 | Wyoming | 578759 | 481500 | 83.2 | 4773 | 0.8 | 95050 | 16.9 | 7019 | ... | 0.9 | 7.3 | 56346 | 10.0 | 6346 | 1.1 | 21.3 | 3.9 | 36.7 | 5.4 |
| 51 | 72 | Puerto Rico | 3193694 | 3186000 | 99.8 | 2618 | 0.1 | 1906000 | 60.4 | 21140 | ... | 0.4 | 0.1 | 879219 | 27.8 | 19431 | 0.6 | NaN | NaN | NaN | NaN |
df2| Variable Name | Description | Source(s) | |
|---|---|---|---|
| 0 | st | State Code (FIPS) | 2019 ACS 1-Year file |
| 1 | statename | State Name | Vintage 2019 Population Estimates Program Geoc... |
| 2 | state_tot_pop | 2019 State resident population | Table S0101: Age and Sex (2019 ACS 1-Year file) |
| 3 | tot_cov_pop | 2019 Total covered populations in State (popul... | Derived from 2019 ACS 1-Year file and 2015-201... |
| 4 | pct_tot_cov_pop | 2019 Percentage of State population in total c... | Derived from 2019 ACS 1-Year file and 2015-201... |
| 5 | tot_cov_pop_MOE | 2019 Total covered populations in State margin... | Margin of error at the 90 percent confidence l... |
| 6 | pct_tot_cov_MOE | 2019 Percentage of state population in total c... | Margin of error at the 90 percent confidence l... |
| 7 | ipr_pop | 2019 State household population in "covered ho... | 2019 ACS 1-Year file. \nEstimate is rounded to... |
| 8 | pct_ipr_pop | 2019 Percentage of State household population ... | 2019 ACS 1-Year file |
| 9 | ipr_pop_MOE | 2019 State household population in "covered ho... | Margin of error at the 90 percent confidence l... |
| 10 | pct_ipr_MOE | 2019 Percentage of State household population ... | Margin of error at the 90 percent confidence l... |
| 11 | aging_pop | 2019 State population age 60 years and older | Table S0101: Age and Sex (2019 ACS 1-Year file) |
| 12 | pct_aging_pop | 2019 Percentage of State population age 60 yea... | Table S0101: Age and Sex (2019 ACS 1-Year file) |
| 13 | aging_pop_MOE | 2019 State population age 60 years and older m... | Table S0101: Age and Sex (2019 ACS 1-Year file... |
| 14 | pct_aging_MOE | 2019 Percentage of State population age 60 yea... | Table S0101: Age and Sex (2019 ACS 1-Year file... |
| 15 | pct_incarc_pop | 2019 Percentage of State population incarcerat... | 2019 ACS 1-Year file |
| 16 | pct_incarc_MOE | 2019 Percentage of State population incarcerat... | Margin of error at the 90 percent confidence l... |
| 17 | vet_pop | 2019 State veteran population age 18 years and... | Table B21001: Sex by Age by Veteran Status for... |
| 18 | pct_vet_pop | 2019 Percentage of State population who are ve... | Table B21001: Sex by Age by Veteran Status for... |
| 19 | vet_pop_MOE | 2019 State veteran population aged 18 years an... | Table B21001: Sex by Age by Veteran Status for... |
| 20 | pct_vet_MOE | 2019 Percentage of State population who are ve... | Margin of error at the 90 percent confidence l... |
| 21 | dis_pop | 2019 State population with one or more disabil... | 2019 ACS 1-Year file. \nEstimate is rounded to... |
| 22 | pct_dis_pop | 2019 Percentage of State population with one o... | 2019 ACS 1-Year file |
| 23 | dis_pop_MOE | 2019 State population with one or more disabil... | Margin of error at the 90 percent confidence l... |
| 24 | pct_dis_MOE | 2019 Percentage of State population with one o... | Margin of error at the 90 percent confidence l... |
| 25 | lang_barrier_pop | 2019 State population with a language barrier ... | Derived from 2019 ACS 1-Year file (for speaks ... |
| 26 | pct_lang_barrier_pop | 2019 Percentage of State population with a lan... | Derived from 2019 ACS 1-Year file (for speaks ... |
| 27 | lang_barrier_pop_MOE | 2019 State population with a language barrier ... | Margin of error at the 90 percent confidence l... |
| 28 | pct_lang_barrier_MOE | 2019 Percentage of State population with a lan... | Margin of error at the 90 percent confidence l... |
| 29 | lang_pop | 2019 State population 5 years and older who sp... | Table S1601: Language Spoken at Home (2019 ACS... |
| 30 | pct_lang_pop | 2019 Percentage of State population 5 years an... | Table S1601: Language Spoken at Home (2019 ACS... |
| 31 | lang_pop_MOE | 2019 State population 5 years and older who sp... | Table S1601: Language Spoken at Home (2019 ACS... |
| 32 | pct_lang_MOE | 2019 Percentage of State population 5 years an... | Table S1601: Language Spoken at Home (2019 ACS... |
| 33 | pct_low_literacy_pop_nces | Percentage of State household population aged ... | 2012/2014/2017 Program for the International A... |
| 34 | pct_low_literacy_nces_MOE | Percentage of State household population aged ... | 2012/2014/2017 Program for the International A... |
| 35 | minority_pop | 2019 State population who identify as a race o... | Table DP05: ACS Demographic and Housing Estima... |
| 36 | pct_minority_pop | 2019 Percentage of State population who identi... | Table DP05: ACS Demographic and Housing Estima... |
| 37 | minority_pop_MOE | 2019 State population who identify as a race o... | Table DP05: ACS Demographic and Housing Estima... |
| 38 | pct_minority_MOE | 2019 Percentage of State population who identi... | Table DP05: ACS Demographic and Housing Estima... |
| 39 | rural_pop | 2019 State population living in rural areas | Derived from 2019 ACS 1-Year file and 2015-201... |
| 40 | pct_rural_pop | 2019 Percentage of State population living in ... | Derived from 2019 ACS 1-Year file and 2015-201... |
| 41 | rural_pop_MOE | 2019 State population living in rural areas ma... | Derived from 2019 ACS 1-Year file and 2015-201... |
| 42 | pct_rural_MOE | 2019 Percentage of State population living in ... | Derived from 2019 ACS 1-Year file and 2015-201... |
| 43 | pct_no_fixed_bb_pop_fcc | 2019 Percentage of State population living in ... | Fourteenth Broadband Deployment Report, Append... |
| 44 | no_bb_or_computer_pop | 2019 State population living in households tha... | Table S2802: Types of Internet Subscriptions b... |
| 45 | pct_no_bb_or_computer_pop | 2019 Percentage of State population living in ... | Table S2802: Types of Internet Subscriptions b... |
| 46 | no_bb_or_computer_pop_MOE | 2019 State population living in households tha... | Table S2802: Types of Internet Subscriptions b... |
| 47 | pct_no_bb_or_computer_MOE | 2019 Percentage of State population living in ... | Table S2802: Types of Internet Subscriptions b... |
| 48 | pct_not_inter_user_pop_ntia | 2021 Percentage of State civilian population 3... | 2021 National Telecommunications and Informati... |
| 49 | pct_not_inter_user_ntia_MOE | 2021 Percentage of State civilian population 3... | 2021 National Telecommunications and Informati... |
| 50 | pct_no_pc_tablet_pop_ntia | 2021 Percentage of State civilian population 3... | 2021 National Telecommunications and Informati... |
| 51 | pct_no_pc_tablet_ntia_MOE | 2021 Percentage of State civilian population 3... | 2021 National Telecommunications and Informati... |
Loading multiple sheets by sheet name
We can also use the names of the sheets. Both will yield the same result.
import pandas as pd
df1 = pd.read_excel("state_total_covered_populations.xslx", sheet_name='state_total_covered_populations')
df2 =  pd.read_excel("state_total_covered_populations.xslx", sheet_name='codebook')
df1| st | statename | state_tot_pop | tot_cov_pop | pct_tot_cov_pop | tot_cov_pop_MOE | pct_tot_cov_MOE | ipr_pop | pct_ipr_pop | ipr_pop_MOE | ... | pct_rural_MOE | pct_no_fixed_bb_pop_fcc | no_bb_or_computer_pop | pct_no_bb_or_computer_pop | no_bb_or_computer_pop_MOE | pct_no_bb_or_computer_MOE | pct_not_inter_user_pop_ntia | pct_not_inter_user_ntia_MOE | pct_no_pc_tablet_pop_ntia | pct_no_pc_tablet_ntia_MOE | |
|---|---|---|---|---|---|---|---|---|---|---|---|---|---|---|---|---|---|---|---|---|---|
| 0 | 1 | Alabama | 4903185 | 4261000 | 86.9 | 13540 | 0.3 | 1210000 | 25.4 | 29140 | ... | 0.4 | 12.4 | 714086 | 14.9 | 21655 | 0.5 | 21.7 | 2.7 | 38.8 | 2.2 |
| 1 | 2 | Alaska | 731545 | 603000 | 82.4 | 4776 | 0.7 | 125300 | 17.9 | 8569 | ... | 0.5 | 14.8 | 65852 | 9.3 | 5630 | 0.8 | 17.7 | 2.6 | 29.9 | 2.8 |
| 2 | 4 | Arizona | 7278717 | 5808000 | 79.8 | 19540 | 0.3 | 1557000 | 22.0 | 33110 | ... | 0.2 | 5.2 | 788293 | 11.1 | 29081 | 0.4 | 21.1 | 2.9 | 38.2 | 3.0 |
| 3 | 5 | Arkansas | 3017804 | 2637000 | 87.4 | 11150 | 0.4 | 811100 | 27.8 | 22370 | ... | 0.4 | 19.0 | 467370 | 15.9 | 18153 | 0.6 | 18.2 | 2.3 | 37.8 | 2.9 |
| 4 | 6 | California | 39512223 | 33560000 | 84.9 | 30750 | 0.1 | 7509000 | 19.5 | 78070 | ... | 0.1 | 1.5 | 3062449 | 7.9 | 52570 | 0.1 | 18.8 | 1.1 | 32.8 | 1.2 |
| 5 | 8 | Colorado | 5758736 | 4142000 | 71.9 | 18310 | 0.3 | 871800 | 15.5 | 25750 | ... | 0.2 | 2.8 | 374151 | 6.6 | 17488 | 0.3 | 14.6 | 2.7 | 28.7 | 3.4 |
| 6 | 9 | Connecticut | 3565287 | 2647000 | 74.2 | 12730 | 0.4 | 560000 | 16.3 | 18880 | ... | 0.3 | 0.8 | 279524 | 8.1 | 17594 | 0.5 | 22.8 | 4.1 | 33.2 | 4.5 |
| 7 | 10 | Delaware | 973764 | 827900 | 85.0 | 4971 | 0.5 | 168400 | 17.9 | 12580 | ... | 0.5 | 2.2 | 89025 | 9.4 | 8577 | 0.9 | 18.3 | 2.9 | 33.7 | 3.0 |
| 8 | 11 | District of Columbia | 705749 | 518700 | 73.5 | 2930 | 0.4 | 123700 | 18.6 | 8741 | ... | ***** | 2.0 | 71696 | 10.8 | 7904 | 1.2 | 14.2 | 2.5 | 24.2 | 2.9 |
| 9 | 12 | Florida | 21477737 | 17820000 | 83.0 | 38950 | 0.2 | 4586000 | 21.9 | 65560 | ... | 0.2 | 3.7 | 2257431 | 10.7 | 59851 | 0.3 | 25.4 | 1.8 | 40.0 | 2.0 |
| 10 | 13 | Georgia | 10617423 | 9046000 | 85.2 | 22290 | 0.2 | 2294000 | 22.3 | 44170 | ... | 0.2 | 6.2 | 1272071 | 12.3 | 40855 | 0.4 | 18.8 | 2.6 | 33.6 | 3.4 |
| 11 | 15 | Hawaii | 1415872 | 1330000 | 93.9 | 3985 | 0.3 | 190900 | 14.0 | 12500 | ... | 0.7 | 2.1 | 119595 | 8.7 | 10028 | 0.7 | 20.8 | 3.3 | 36.8 | 3.6 |
| 12 | 16 | Idaho | 1787065 | 1361000 | 76.2 | 12540 | 0.7 | 362000 | 20.7 | 16100 | ... | 0.5 | 4.7 | 149117 | 8.5 | 11854 | 0.7 | 11.4 | 1.8 | 27.0 | 2.6 |
| 13 | 17 | Illinois | 12671821 | 9905000 | 78.2 | 23500 | 0.2 | 2298000 | 18.6 | 43530 | ... | 0.1 | 2.0 | 1258766 | 10.2 | 29849 | 0.2 | 12.2 | 1.6 | 26.3 | 1.7 |
| 14 | 18 | Indiana | 6732219 | 5304000 | 78.8 | 18290 | 0.3 | 1342000 | 20.6 | 31980 | ... | 0.2 | 3.9 | 825338 | 12.6 | 24022 | 0.4 | 17.0 | 3.5 | 32.9 | 3.0 |
| 15 | 19 | Iowa | 3155070 | 2516000 | 79.7 | 11610 | 0.4 | 580000 | 19.0 | 17180 | ... | 0.4 | 4.0 | 364979 | 11.9 | 15491 | 0.5 | 14.3 | 3.9 | 29.7 | 3.6 |
| 16 | 20 | Kansas | 2913314 | 2274000 | 78.1 | 10670 | 0.4 | 546400 | 19.4 | 16690 | ... | 0.3 | 4.3 | 311209 | 11.0 | 15763 | 0.6 | 15.9 | 3.1 | 31.5 | 3.8 |
| 17 | 21 | Kentucky | 4467673 | 3742000 | 83.8 | 14910 | 0.3 | 1105000 | 25.6 | 26660 | ... | 0.3 | 5.7 | 563191 | 13.0 | 20612 | 0.5 | 19.0 | 4.4 | 37.1 | 4.7 |
| 18 | 22 | Louisiana | 4648794 | 4087000 | 87.9 | 12500 | 0.3 | 1284000 | 28.5 | 30890 | ... | 0.4 | 11.6 | 708799 | 15.7 | 21704 | 0.5 | 17.1 | 2.5 | 38.1 | 3.6 |
| 19 | 23 | Maine | 1344212 | 1196000 | 89.0 | 7398 | 0.6 | 239500 | 18.5 | 11840 | ... | 0.6 | 3.5 | 149709 | 11.5 | 9033 | 0.7 | 14.6 | 2.9 | 25.8 | 3.3 |
| 20 | 24 | Maryland | 6045680 | 5017000 | 83.0 | 13200 | 0.2 | 847200 | 14.4 | 27380 | ... | 0.2 | 2.5 | 504996 | 8.6 | 24626 | 0.4 | 17.5 | 2.9 | 32.6 | 3.1 |
| 21 | 25 | Massachusetts | 6892503 | 4727000 | 68.6 | 18990 | 0.3 | 980100 | 14.8 | 23900 | ... | 0.2 | 2.0 | 530525 | 8.0 | 18971 | 0.3 | 19.5 | 2.1 | 30.5 | 2.5 |
| 22 | 26 | Michigan | 9986857 | 8051000 | 80.6 | 22790 | 0.2 | 2032000 | 20.9 | 33170 | ... | 0.2 | 4.2 | 1032538 | 10.6 | 25365 | 0.3 | 18.5 | 2.4 | 31.9 | 2.9 |
| 23 | 27 | Minnesota | 5639632 | 4168000 | 73.9 | 16240 | 0.3 | 819600 | 14.9 | 20460 | ... | 0.2 | 2.5 | 461115 | 8.4 | 15395 | 0.3 | 13.2 | 2.5 | 23.6 | 3.1 |
| 24 | 28 | Mississippi | 2976149 | 2754000 | 92.5 | 10090 | 0.3 | 893400 | 31.1 | 28030 | ... | 0.4 | 19.7 | 535054 | 18.6 | 18099 | 0.6 | 21.9 | 2.7 | 40.7 | 2.8 |
| 25 | 29 | Missouri | 6137428 | 4858000 | 79.2 | 14730 | 0.2 | 1276000 | 21.5 | 27350 | ... | 0.2 | 6.9 | 695984 | 11.7 | 18843 | 0.3 | 18.0 | 2.5 | 32.5 | 3.8 |
| 26 | 30 | Montana | 1068778 | 890500 | 83.3 | 6458 | 0.6 | 215000 | 20.8 | 10150 | ... | 0.5 | 13.3 | 113980 | 11.0 | 6659 | 0.6 | 20.2 | 2.4 | 29.5 | 2.9 |
| 27 | 31 | Nebraska | 1934408 | 1446000 | 74.8 | 9353 | 0.5 | 339400 | 18.1 | 13070 | ... | 0.3 | 3.7 | 167216 | 8.9 | 7492 | 0.4 | 18.6 | 2.8 | 30.0 | 2.5 |
| 28 | 32 | Nevada | 3080156 | 2533000 | 82.2 | 11110 | 0.4 | 626100 | 20.7 | 23210 | ... | 0.3 | 2.9 | 360050 | 11.8 | 21334 | 0.7 | 27.5 | 2.9 | 39.1 | 3.0 |
| 29 | 33 | New Hampshire | 1359711 | 1071000 | 78.8 | 8908 | 0.7 | 162100 | 12.3 | 10370 | ... | 0.6 | 3.2 | 99795 | 7.6 | 7257 | 0.6 | 15.6 | 2.5 | 24.9 | 2.7 |
| 30 | 34 | New Jersey | 8882190 | 6746000 | 75.9 | 19610 | 0.2 | 1300000 | 15.0 | 31020 | ... | 0.2 | 1.5 | 705327 | 8.1 | 24463 | 0.3 | 14.7 | 2.1 | 29.5 | 2.5 |
| 31 | 35 | New Mexico | 2096829 | 1916000 | 91.4 | 6298 | 0.3 | 585400 | 28.6 | 20230 | ... | 0.5 | 12.9 | 382546 | 18.6 | 15767 | 0.8 | 19.5 | 3.1 | 40.9 | 5.2 |
| 32 | 36 | New York | 19453561 | 15730000 | 80.9 | 23660 | 0.1 | 3722000 | 19.8 | 59940 | ... | 0.1 | 1.3 | 2046080 | 10.8 | 47346 | 0.3 | 23.6 | 1.9 | 34.8 | 1.7 |
| 33 | 37 | North Carolina | 10488084 | 8751000 | 83.4 | 20830 | 0.2 | 2320000 | 22.8 | 41940 | ... | 0.2 | 4.5 | 1215297 | 11.9 | 35405 | 0.3 | 22.0 | 2.4 | 38.0 | 2.7 |
| 34 | 38 | North Dakota | 762062 | 563700 | 74.0 | 6619 | 0.9 | 128500 | 17.5 | 8126 | ... | 0.9 | 3.2 | 88649 | 12.0 | 7731 | 1.0 | 21.6 | 2.4 | 32.0 | 3.2 |
| 35 | 39 | Ohio | 11689100 | 8968000 | 76.7 | 26150 | 0.2 | 2397000 | 21.2 | 38570 | ... | 0.2 | 2.8 | 1266088 | 11.1 | 32895 | 0.3 | 19.6 | 2.1 | 36.1 | 2.5 |
| 36 | 40 | Oklahoma | 3956971 | 3308000 | 83.6 | 12440 | 0.3 | 955600 | 24.9 | 18780 | ... | 0.2 | 12.2 | 495737 | 12.9 | 15547 | 0.4 | 21.3 | 3.1 | 39.7 | 3.6 |
| 37 | 41 | Oregon | 4217737 | 3208000 | 76.1 | 13840 | 0.3 | 772300 | 18.8 | 24830 | ... | 0.4 | 5.1 | 335261 | 8.1 | 16027 | 0.4 | 12.6 | 2.1 | 27.0 | 2.6 |
| 38 | 42 | Pennsylvania | 12801989 | 10160000 | 79.4 | 24730 | 0.2 | 2360000 | 19.1 | 42240 | ... | 0.2 | 4.1 | 1356548 | 11.0 | 28067 | 0.2 | 24.3 | 2.6 | 36.6 | 2.7 |
| 39 | 44 | Rhode Island | 1059361 | 750500 | 70.8 | 8733 | 0.8 | 171200 | 16.9 | 11800 | ... | 0.6 | 1.4 | 89495 | 8.8 | 8769 | 0.9 | 18.2 | 3.4 | 31.0 | 3.5 |
| 40 | 45 | South Carolina | 5148714 | 4380000 | 85.1 | 15790 | 0.3 | 1153000 | 23.1 | 34480 | ... | 0.4 | 8.7 | 720310 | 14.4 | 26065 | 0.5 | 18.7 | 2.1 | 32.3 | 2.4 |
| 41 | 46 | South Dakota | 884659 | 722200 | 81.6 | 5421 | 0.6 | 163000 | 19.3 | 8177 | ... | 0.5 | 5.0 | 104435 | 12.3 | 6172 | 0.7 | 15.4 | 3.1 | 34.2 | 3.5 |
| 42 | 47 | Tennessee | 6829174 | 5604000 | 82.1 | 18770 | 0.3 | 1525000 | 23.0 | 30750 | ... | 0.2 | 6.3 | 895081 | 13.4 | 27605 | 0.4 | 20.9 | 2.0 | 35.9 | 2.6 |
| 43 | 48 | Texas | 28995881 | 24830000 | 85.6 | 36320 | 0.1 | 6547000 | 23.1 | 94340 | ... | 0.1 | 4.2 | 3246038 | 11.4 | 60334 | 0.2 | 23.0 | 1.8 | 40.0 | 1.9 |
| 44 | 49 | Utah | 3205958 | 1969000 | 61.4 | 15460 | 0.5 | 503100 | 16.0 | 18510 | ... | 0.2 | 4.3 | 210086 | 6.7 | 12840 | 0.4 | 15.6 | 3.3 | 27.5 | 3.7 |
| 45 | 50 | Vermont | 623989 | 602700 | 96.6 | 2100 | 0.3 | 105300 | 17.7 | 6385 | ... | 0.1 | 6.9 | 76578 | 12.8 | 6414 | 1.1 | 17.1 | 2.6 | 29.3 | 3.2 |
| 46 | 51 | Virginia | 8535519 | 6925000 | 81.1 | 18230 | 0.2 | 1364000 | 16.5 | 34110 | ... | 0.2 | 5.8 | 836641 | 10.1 | 25001 | 0.3 | 19.5 | 2.4 | 35.2 | 3.2 |
| 47 | 53 | Washington | 7614893 | 5752000 | 75.5 | 22200 | 0.3 | 1196000 | 16.1 | 30080 | ... | 0.3 | 3.7 | 470559 | 6.3 | 19853 | 0.3 | 16.1 | 2.5 | 28.7 | 2.4 |
| 48 | 54 | West Virginia | 1792147 | 1736000 | 96.9 | 4348 | 0.2 | 459100 | 26.5 | 16070 | ... | 0.1 | 17.8 | 252050 | 14.4 | 10619 | 0.6 | 19.8 | 2.2 | 36.9 | 4.4 |
| 49 | 55 | Wisconsin | 5822434 | 4600000 | 79.0 | 15370 | 0.3 | 975800 | 17.2 | 21340 | ... | 0.2 | 6.8 | 589985 | 10.4 | 12196 | 0.2 | 12.2 | 2.5 | 30.3 | 3.5 |
| 50 | 56 | Wyoming | 578759 | 481500 | 83.2 | 4773 | 0.8 | 95050 | 16.9 | 7019 | ... | 0.9 | 7.3 | 56346 | 10.0 | 6346 | 1.1 | 21.3 | 3.9 | 36.7 | 5.4 |
| 51 | 72 | Puerto Rico | 3193694 | 3186000 | 99.8 | 2618 | 0.1 | 1906000 | 60.4 | 21140 | ... | 0.4 | 0.1 | 879219 | 27.8 | 19431 | 0.6 | NaN | NaN | NaN | NaN |
df2| Variable Name | Description | Source(s) | |
|---|---|---|---|
| 0 | st | State Code (FIPS) | 2019 ACS 1-Year file |
| 1 | statename | State Name | Vintage 2019 Population Estimates Program Geoc... |
| 2 | state_tot_pop | 2019 State resident population | Table S0101: Age and Sex (2019 ACS 1-Year file) |
| 3 | tot_cov_pop | 2019 Total covered populations in State (popul... | Derived from 2019 ACS 1-Year file and 2015-201... |
| 4 | pct_tot_cov_pop | 2019 Percentage of State population in total c... | Derived from 2019 ACS 1-Year file and 2015-201... |
| 5 | tot_cov_pop_MOE | 2019 Total covered populations in State margin... | Margin of error at the 90 percent confidence l... |
| 6 | pct_tot_cov_MOE | 2019 Percentage of state population in total c... | Margin of error at the 90 percent confidence l... |
| 7 | ipr_pop | 2019 State household population in "covered ho... | 2019 ACS 1-Year file. \nEstimate is rounded to... |
| 8 | pct_ipr_pop | 2019 Percentage of State household population ... | 2019 ACS 1-Year file |
| 9 | ipr_pop_MOE | 2019 State household population in "covered ho... | Margin of error at the 90 percent confidence l... |
| 10 | pct_ipr_MOE | 2019 Percentage of State household population ... | Margin of error at the 90 percent confidence l... |
| 11 | aging_pop | 2019 State population age 60 years and older | Table S0101: Age and Sex (2019 ACS 1-Year file) |
| 12 | pct_aging_pop | 2019 Percentage of State population age 60 yea... | Table S0101: Age and Sex (2019 ACS 1-Year file) |
| 13 | aging_pop_MOE | 2019 State population age 60 years and older m... | Table S0101: Age and Sex (2019 ACS 1-Year file... |
| 14 | pct_aging_MOE | 2019 Percentage of State population age 60 yea... | Table S0101: Age and Sex (2019 ACS 1-Year file... |
| 15 | pct_incarc_pop | 2019 Percentage of State population incarcerat... | 2019 ACS 1-Year file |
| 16 | pct_incarc_MOE | 2019 Percentage of State population incarcerat... | Margin of error at the 90 percent confidence l... |
| 17 | vet_pop | 2019 State veteran population age 18 years and... | Table B21001: Sex by Age by Veteran Status for... |
| 18 | pct_vet_pop | 2019 Percentage of State population who are ve... | Table B21001: Sex by Age by Veteran Status for... |
| 19 | vet_pop_MOE | 2019 State veteran population aged 18 years an... | Table B21001: Sex by Age by Veteran Status for... |
| 20 | pct_vet_MOE | 2019 Percentage of State population who are ve... | Margin of error at the 90 percent confidence l... |
| 21 | dis_pop | 2019 State population with one or more disabil... | 2019 ACS 1-Year file. \nEstimate is rounded to... |
| 22 | pct_dis_pop | 2019 Percentage of State population with one o... | 2019 ACS 1-Year file |
| 23 | dis_pop_MOE | 2019 State population with one or more disabil... | Margin of error at the 90 percent confidence l... |
| 24 | pct_dis_MOE | 2019 Percentage of State population with one o... | Margin of error at the 90 percent confidence l... |
| 25 | lang_barrier_pop | 2019 State population with a language barrier ... | Derived from 2019 ACS 1-Year file (for speaks ... |
| 26 | pct_lang_barrier_pop | 2019 Percentage of State population with a lan... | Derived from 2019 ACS 1-Year file (for speaks ... |
| 27 | lang_barrier_pop_MOE | 2019 State population with a language barrier ... | Margin of error at the 90 percent confidence l... |
| 28 | pct_lang_barrier_MOE | 2019 Percentage of State population with a lan... | Margin of error at the 90 percent confidence l... |
| 29 | lang_pop | 2019 State population 5 years and older who sp... | Table S1601: Language Spoken at Home (2019 ACS... |
| 30 | pct_lang_pop | 2019 Percentage of State population 5 years an... | Table S1601: Language Spoken at Home (2019 ACS... |
| 31 | lang_pop_MOE | 2019 State population 5 years and older who sp... | Table S1601: Language Spoken at Home (2019 ACS... |
| 32 | pct_lang_MOE | 2019 Percentage of State population 5 years an... | Table S1601: Language Spoken at Home (2019 ACS... |
| 33 | pct_low_literacy_pop_nces | Percentage of State household population aged ... | 2012/2014/2017 Program for the International A... |
| 34 | pct_low_literacy_nces_MOE | Percentage of State household population aged ... | 2012/2014/2017 Program for the International A... |
| 35 | minority_pop | 2019 State population who identify as a race o... | Table DP05: ACS Demographic and Housing Estima... |
| 36 | pct_minority_pop | 2019 Percentage of State population who identi... | Table DP05: ACS Demographic and Housing Estima... |
| 37 | minority_pop_MOE | 2019 State population who identify as a race o... | Table DP05: ACS Demographic and Housing Estima... |
| 38 | pct_minority_MOE | 2019 Percentage of State population who identi... | Table DP05: ACS Demographic and Housing Estima... |
| 39 | rural_pop | 2019 State population living in rural areas | Derived from 2019 ACS 1-Year file and 2015-201... |
| 40 | pct_rural_pop | 2019 Percentage of State population living in ... | Derived from 2019 ACS 1-Year file and 2015-201... |
| 41 | rural_pop_MOE | 2019 State population living in rural areas ma... | Derived from 2019 ACS 1-Year file and 2015-201... |
| 42 | pct_rural_MOE | 2019 Percentage of State population living in ... | Derived from 2019 ACS 1-Year file and 2015-201... |
| 43 | pct_no_fixed_bb_pop_fcc | 2019 Percentage of State population living in ... | Fourteenth Broadband Deployment Report, Append... |
| 44 | no_bb_or_computer_pop | 2019 State population living in households tha... | Table S2802: Types of Internet Subscriptions b... |
| 45 | pct_no_bb_or_computer_pop | 2019 Percentage of State population living in ... | Table S2802: Types of Internet Subscriptions b... |
| 46 | no_bb_or_computer_pop_MOE | 2019 State population living in households tha... | Table S2802: Types of Internet Subscriptions b... |
| 47 | pct_no_bb_or_computer_MOE | 2019 Percentage of State population living in ... | Table S2802: Types of Internet Subscriptions b... |
| 48 | pct_not_inter_user_pop_ntia | 2021 Percentage of State civilian population 3... | 2021 National Telecommunications and Informati... |
| 49 | pct_not_inter_user_ntia_MOE | 2021 Percentage of State civilian population 3... | 2021 National Telecommunications and Informati... |
| 50 | pct_no_pc_tablet_pop_ntia | 2021 Percentage of State civilian population 3... | 2021 National Telecommunications and Informati... |
| 51 | pct_no_pc_tablet_ntia_MOE | 2021 Percentage of State civilian population 3... | 2021 National Telecommunications and Informati... |
Pandas Documentation
The full documentation for read_excel is available in the pandas documentation.