Descriptive Statistics
When you think of descriptive statistics, the first thing that often comes to mind is measures of center and spread!
Measures of center can be things like mean, median, and mode, whereas measures of spread can be range or standard deviation. Below we will look at what all of these are and how to calculate them.
Measures of Center
Measures of center give us insight into the mean (average) value of a dataset, the median value of dataset, the most frequently occurring value, and other properties that usually describe a property of a dataset with a single value.
Measure of Center: Mean / Average
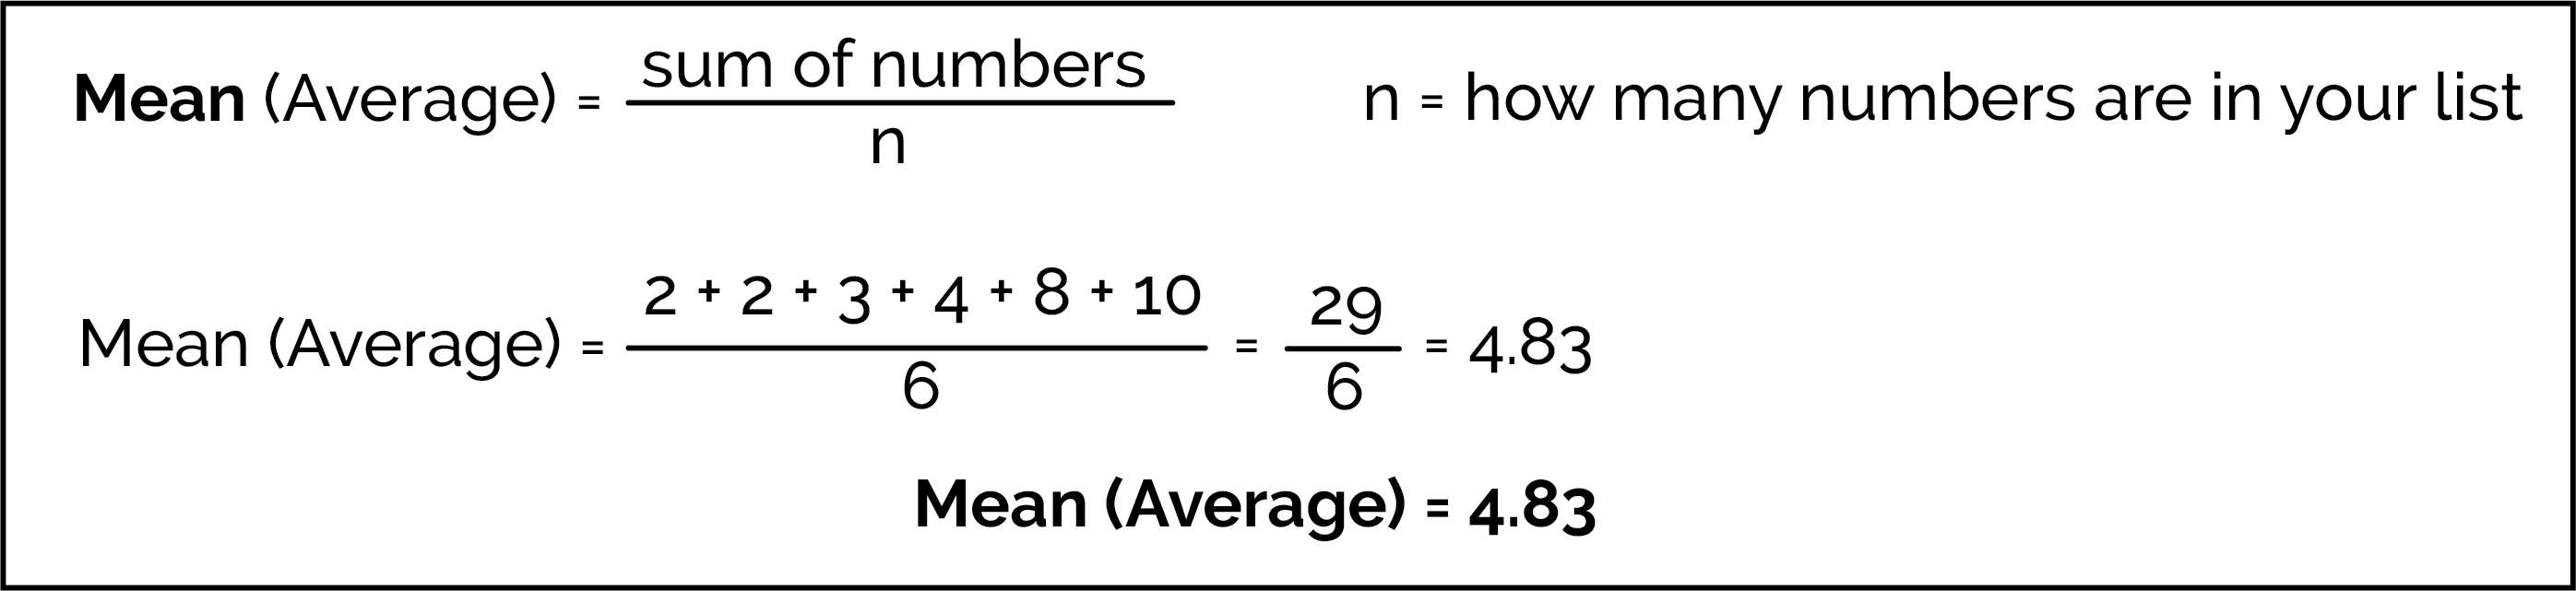
To find the mean (also commonly called the average) of a list of numbers you sum all the numbers and divide by how many there are on the list. For example, we can find the mean of the list of numbers: 2, 2, 3, 4, 8, 10:
Using Python, we can find the mean of ALL values in our data for any specific variable (column):
df['ColumnName'].mean()Important note: If you change any number in your list, the mean will change! It’s very sensitive.
Measure of Center: Median
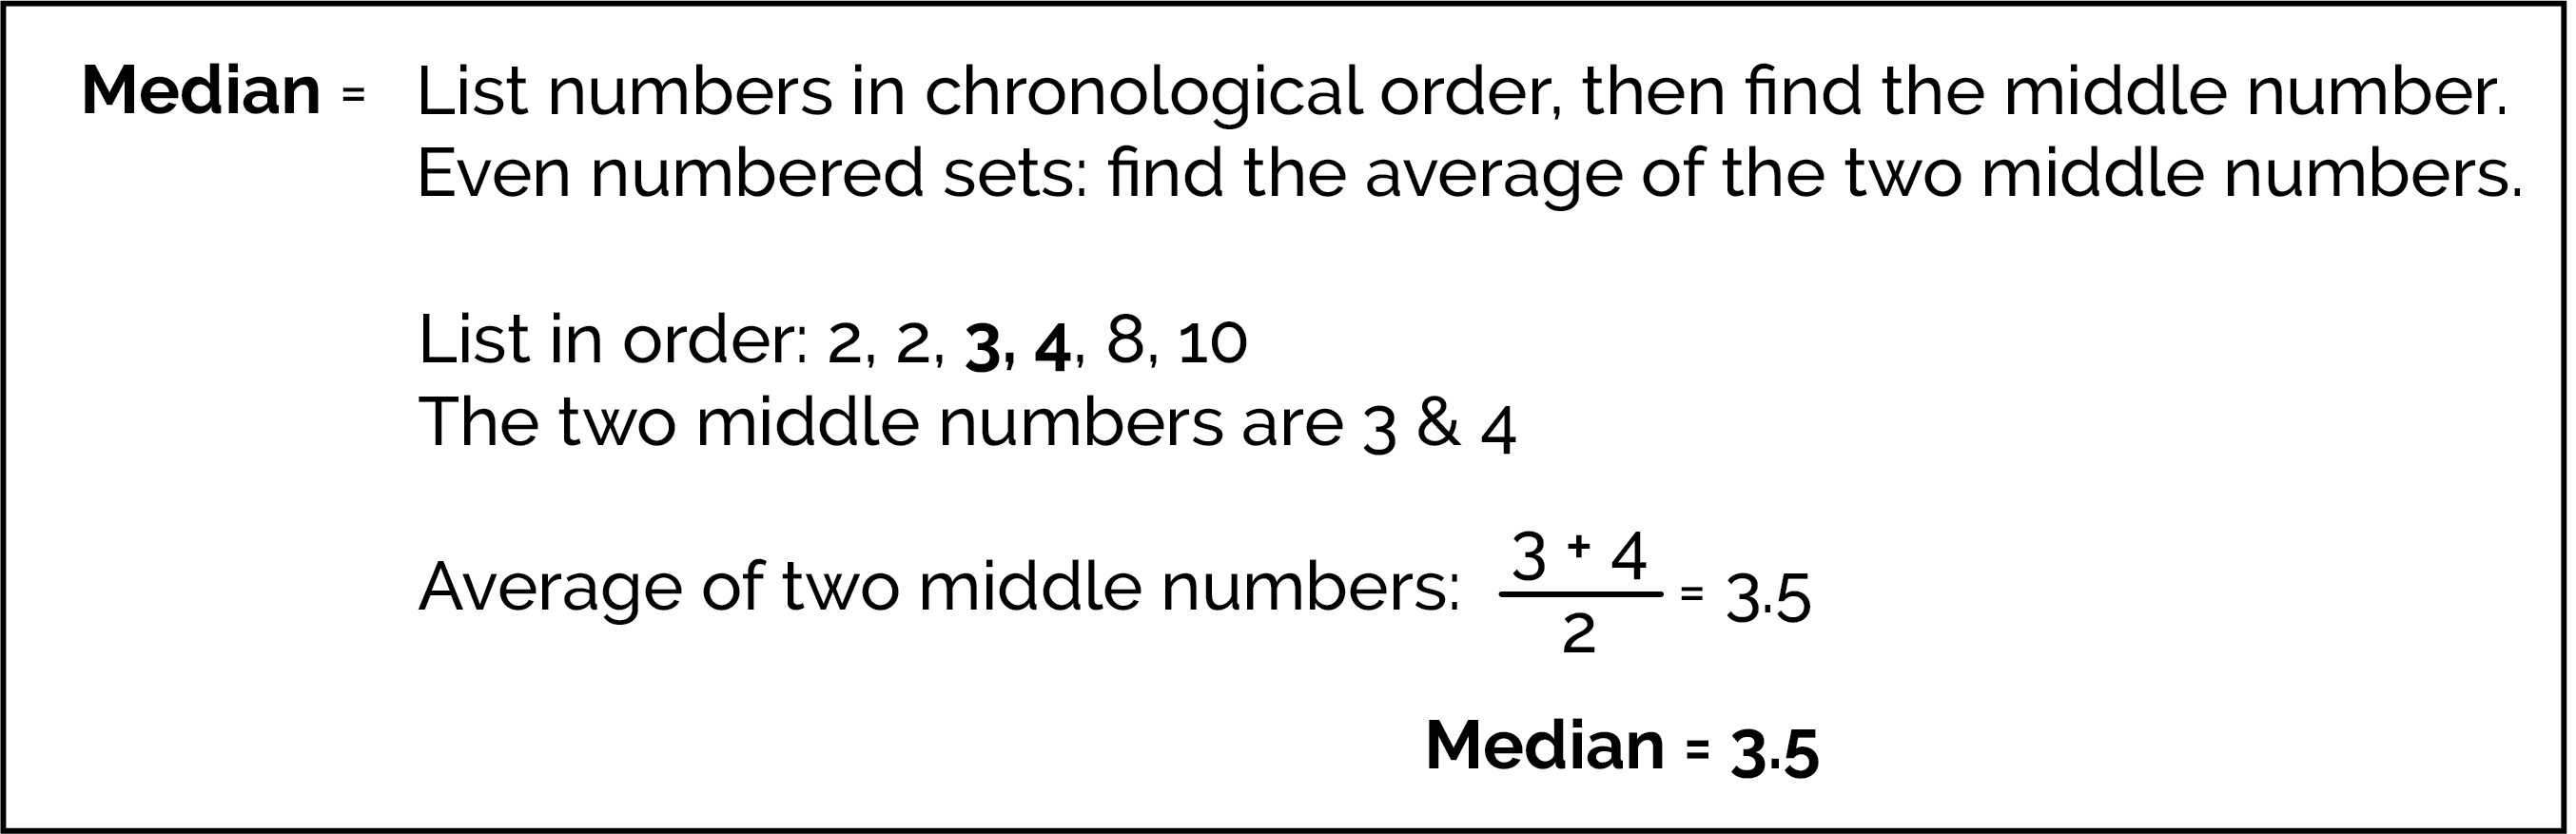
To find the median, list the numbers in order and find the middle number. (Note that with an even number of data points, we really have two "middle" numbers. When there are two "middle numbers", take the average of the two middle numbers to find the median.)
Using the same list of numbers, we can find the median as well:
Using Python, we can find the median of ALL values in our data for any specific variable (column):
df['ColumnName'].median()Important note: Unlike the mean, the median is not sensitive to changes in extreme values. For example, if you add 10 to the biggest number on a list, the median doesn’t change.
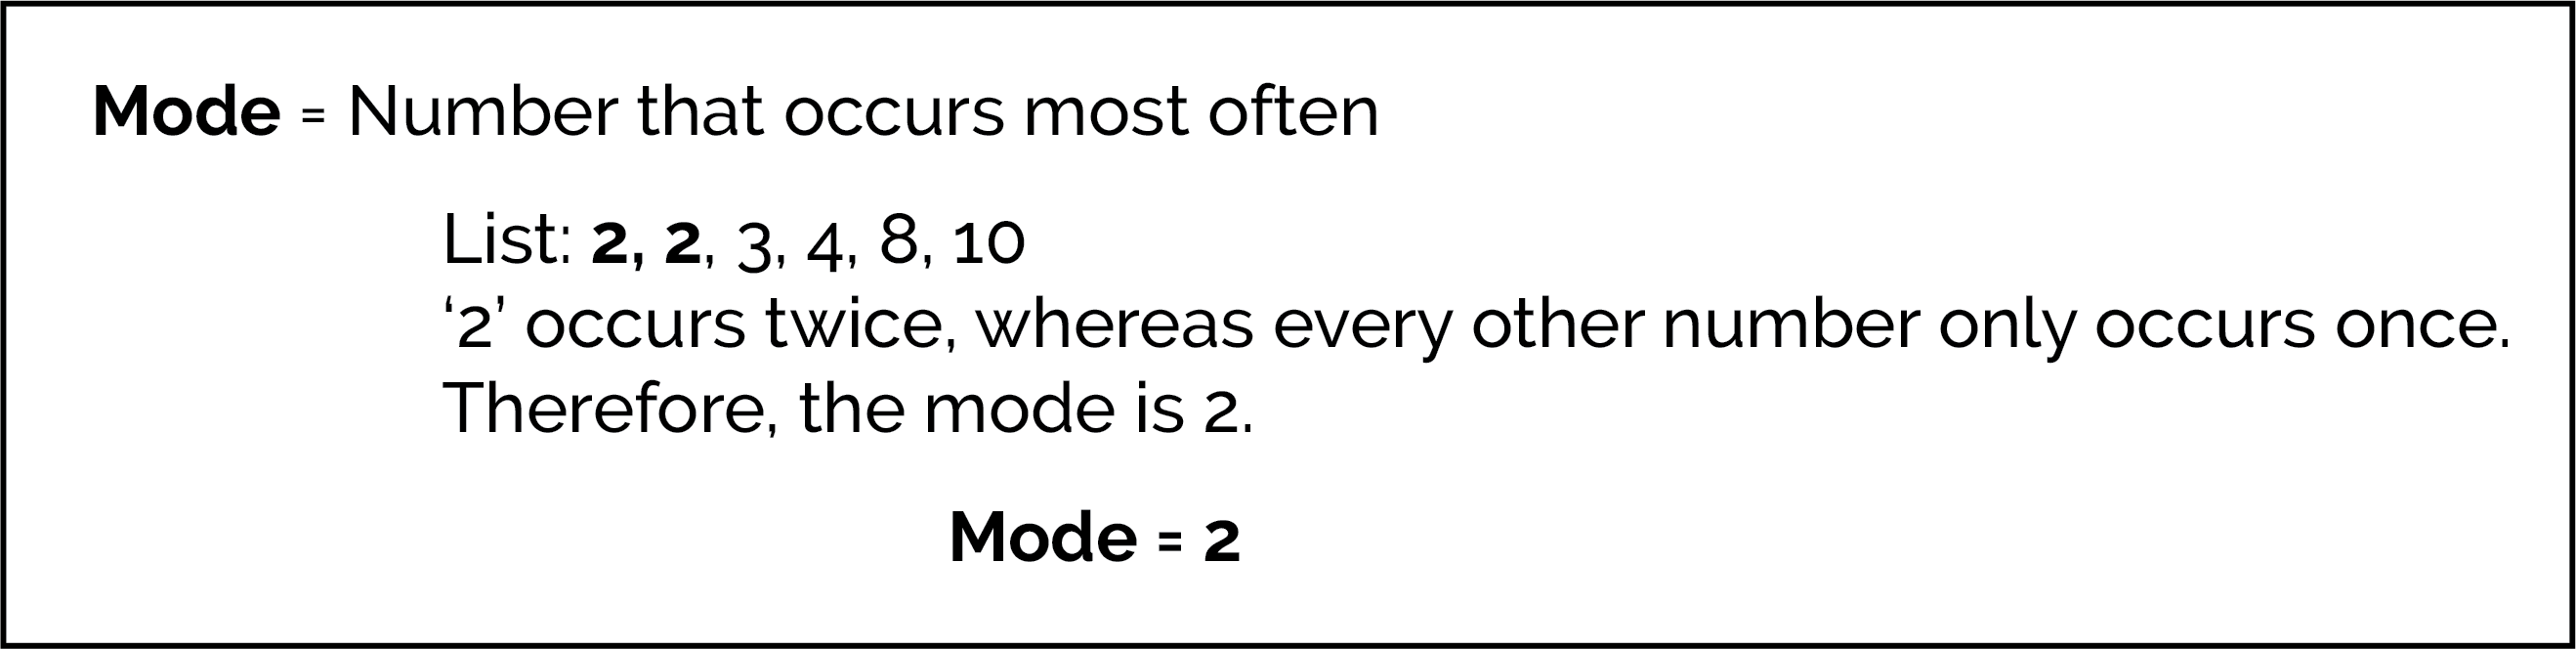
Measure of Center: Mode
The mode is the "most common" number on the list!
Measures of Spread
Measures of spread give us insight into how "spread out" the data is in the dataset with a single value. When measures of spread are small, the data is packed near the center; when the value of spread is large, the data is spread spread out and not concentrated near the center.
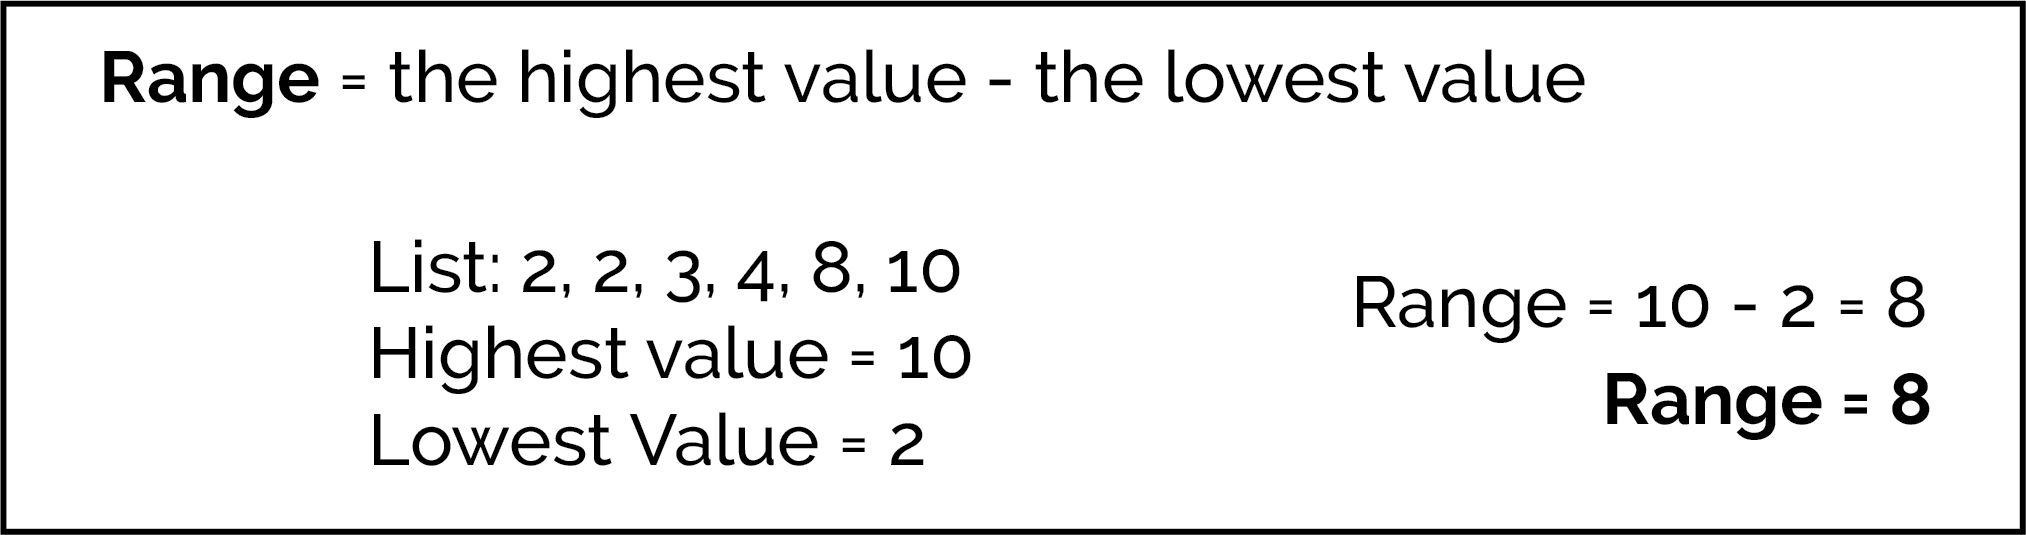
Measure of Spread: Range
The simplest measure of the spread of a list of numbers is the range. The range is defined as the difference between the lowest and highest values.
Using Python, there is no df.range() function. Instead, we calculate the range by taking the maximum value (.max()) and subtracting the minimum value (.min()):
df['ColumnName'].max() - df['ColumnName'].min()Measure of Spread: Variance and Standard Deviation (SD)
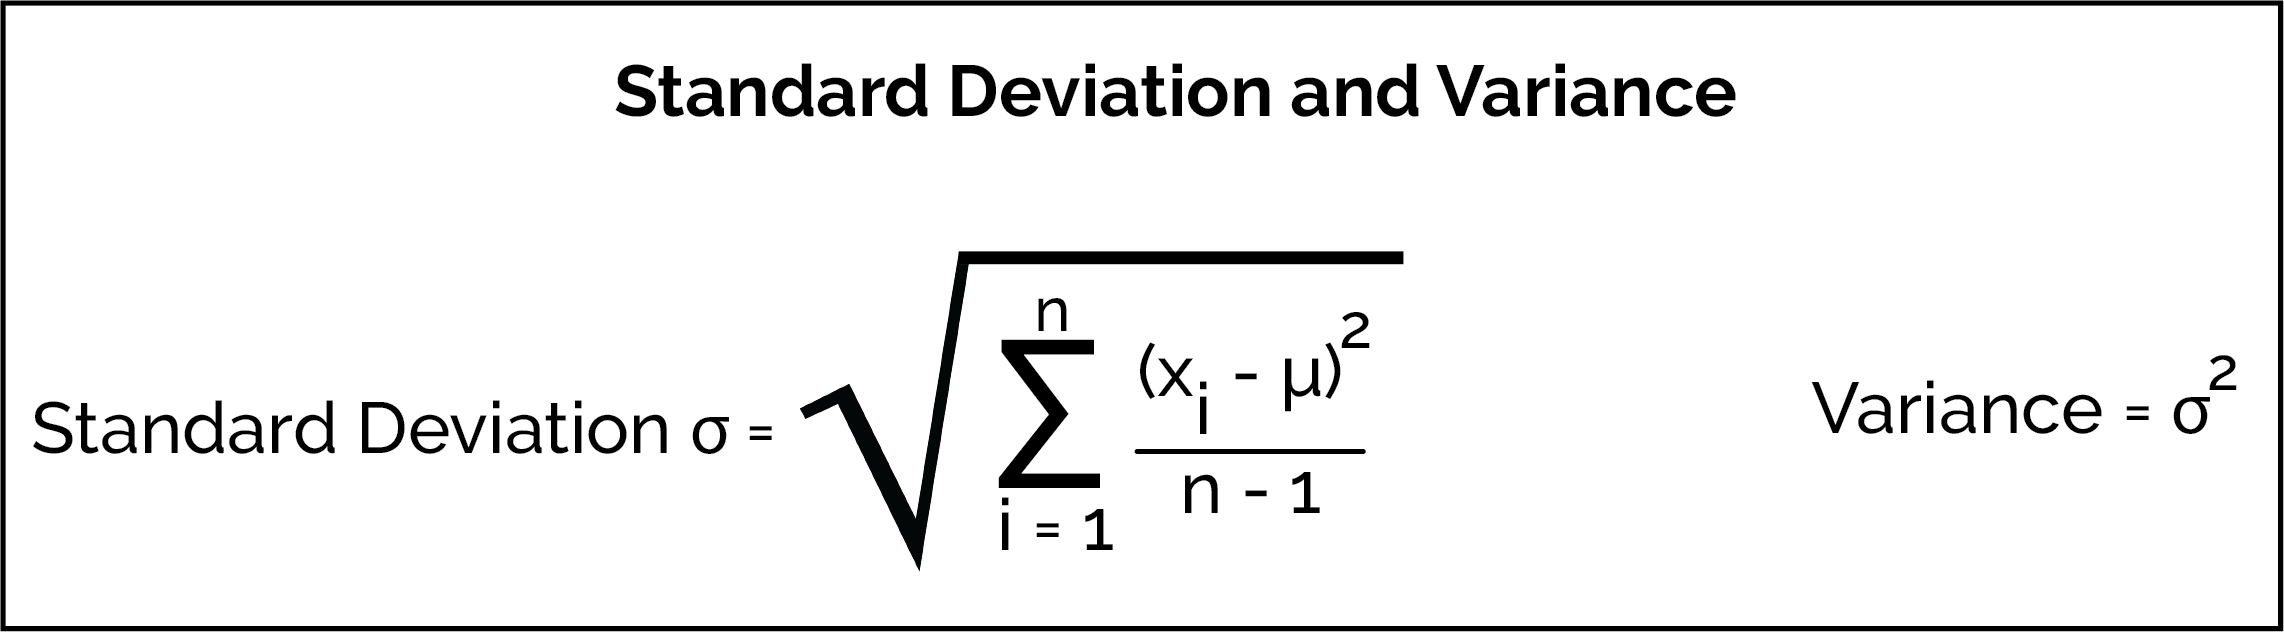
The variance and standard deviation (commonly abbreviated as SD) are measures the spread around the average. Both are calculated by finding the deviation of each value from the mean (average) value of all the values. To calculate both values, we follow five steps:
Calculate the mean (average) of all of the values.
Subtract the mean (average) from each value to find each value's the deviation from the mean.
Find the squared deviation for each value by squaring each deviation that was found in the previous step.
Find the variance by adding all of the squared deviation together and then dividing that sum by n-1. This is the variance and is denoted by mathematically as σ2.
The standard deviation, a related measure of spread, is found by taking the square root of the variance. The standard deviation is denoted mathematically as σ and has the same units as the data.
As an example, we have worked out finding the variance and standard deviation of our list:
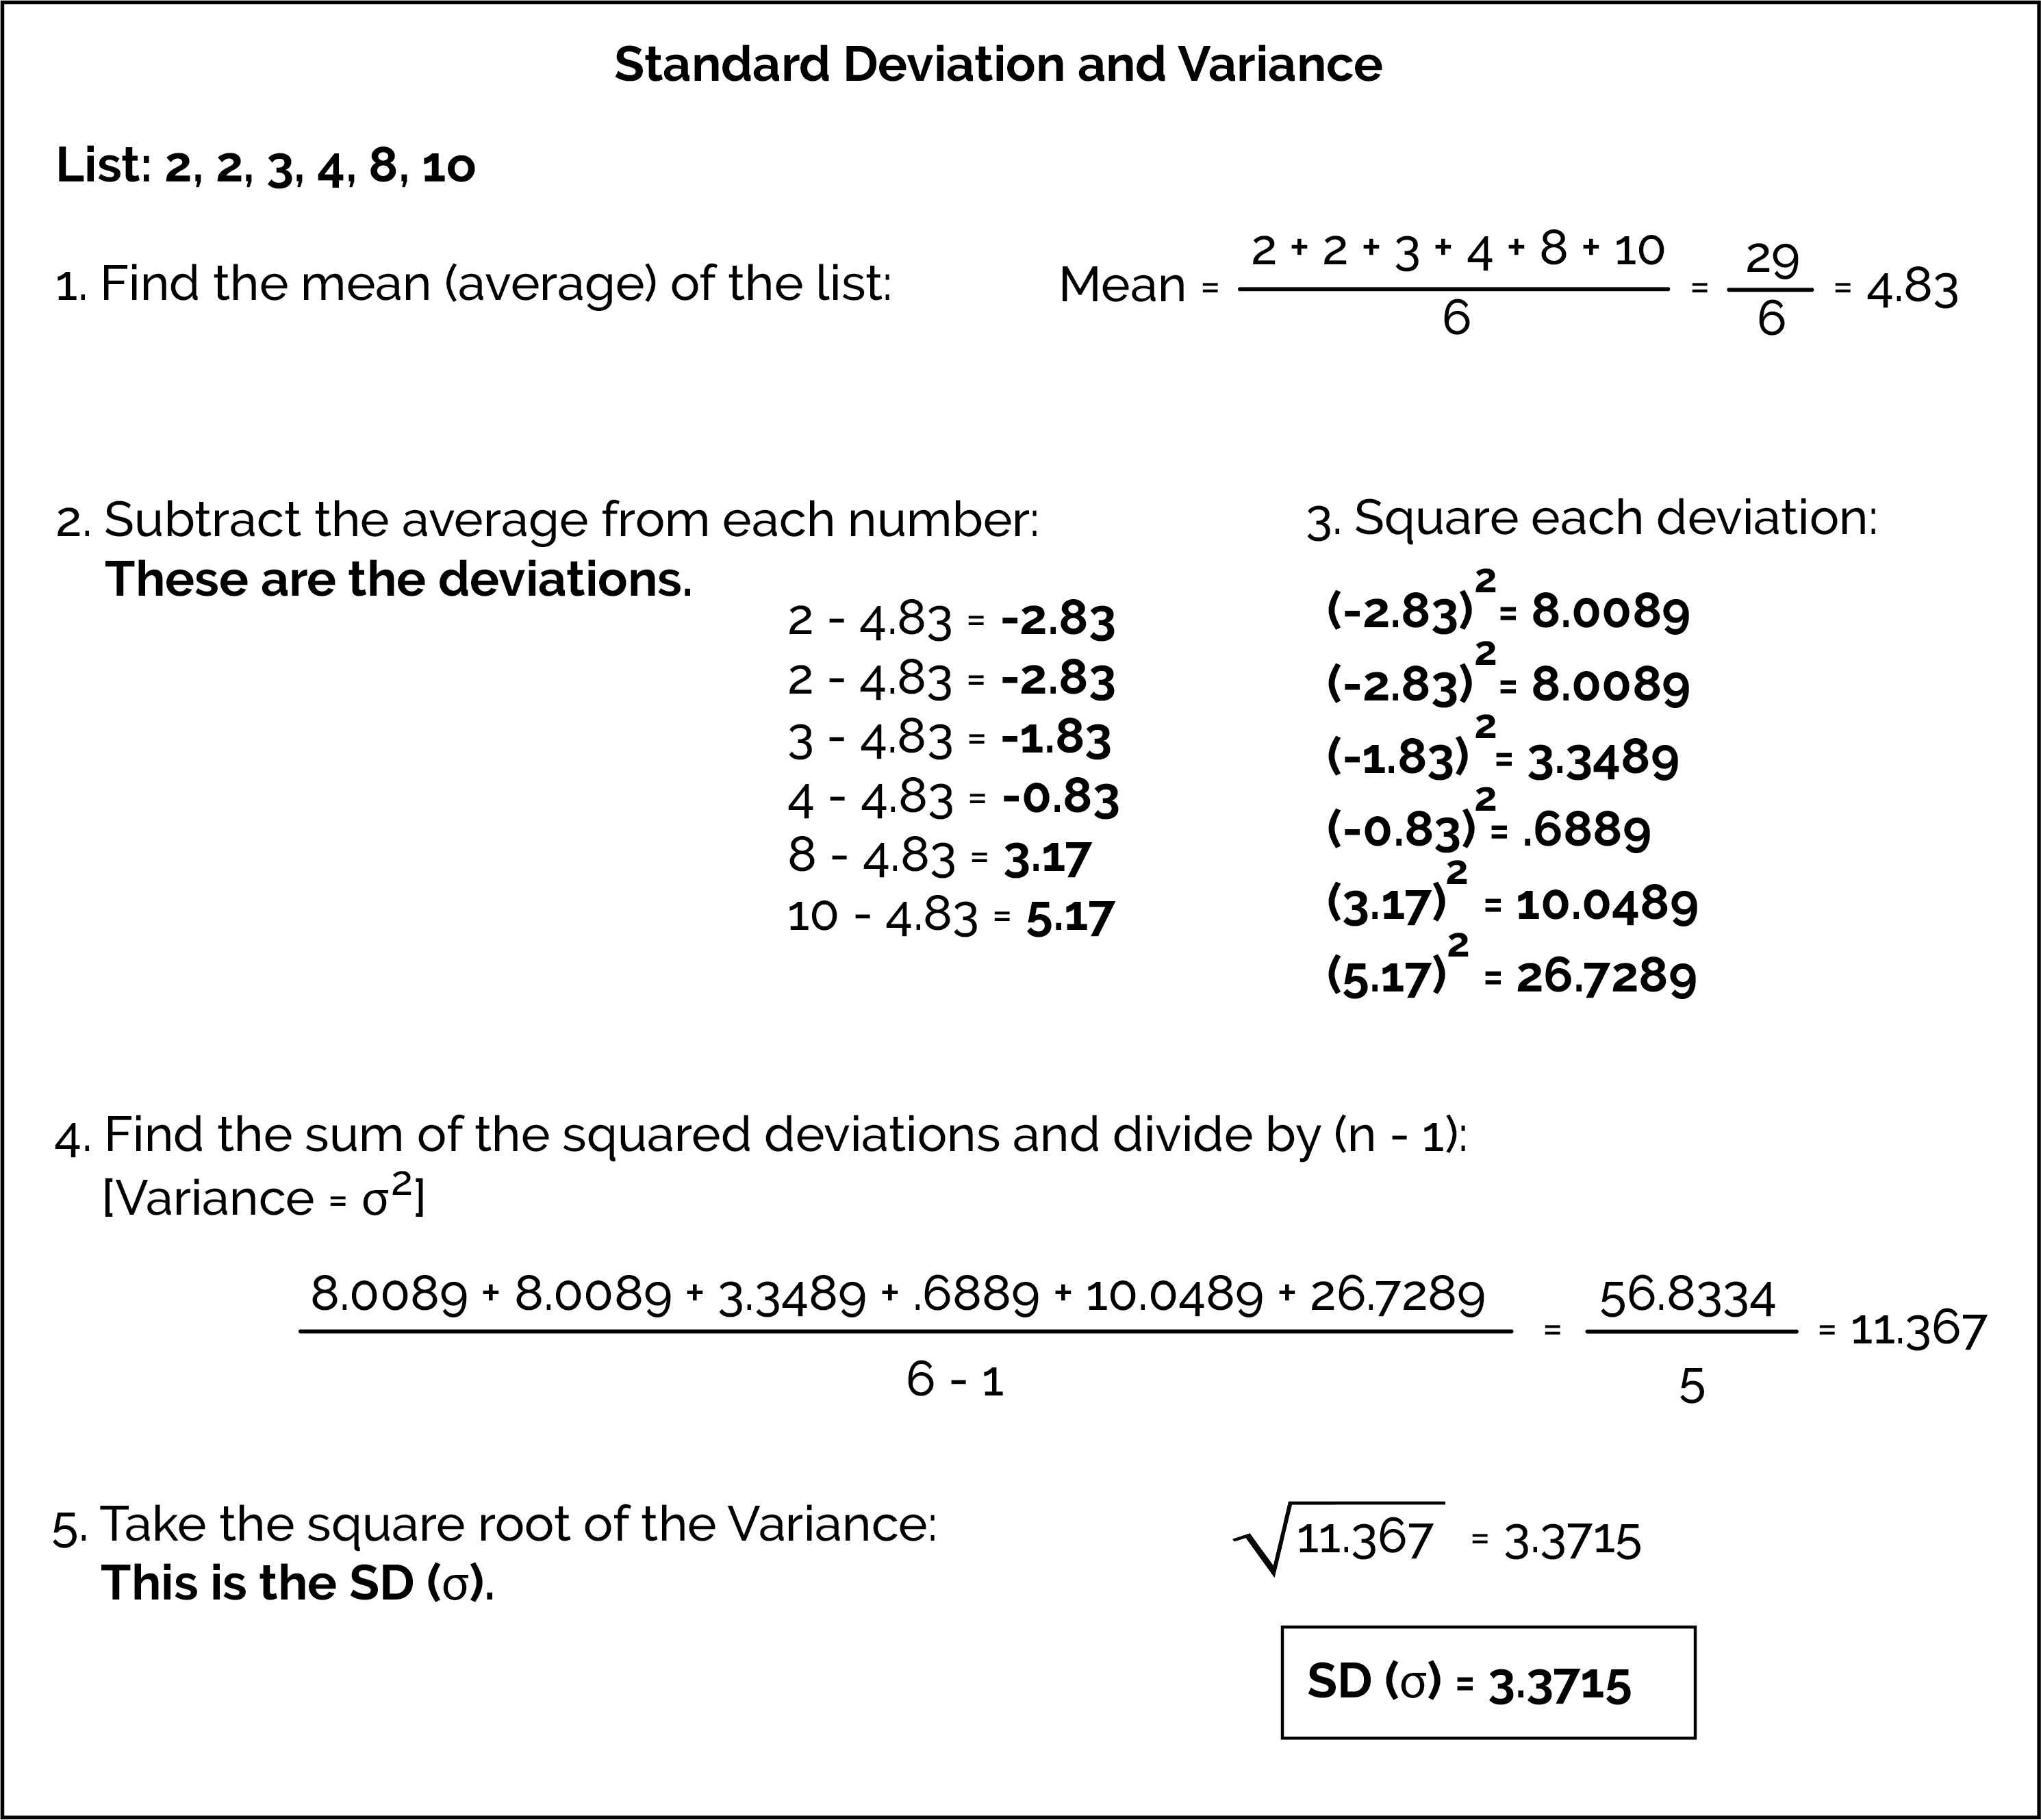
A low SD means that most of the numbers are very close to the average. A high SD means that the numbers are spread out.
Using Python for Measures of Spread
Using Python, the function to return the standard deviation is .std() and variance is .var():
df['ColumnName'].std()df['ColumnName'].var()Mathematical Formula