Exploratory Data Analysis Overview
As a data scientist, you will get new data all the time! The question is, what is the first thing you should do when you get a new dataset?
EDA or Exploratory Data Analysis is the critical process of performing investigations on data. The goal is to get familiar with your data, discover patterns, spot anomalies or outliers, and check assumptions.
EDA is the first few things data scientists usually do when they get a new dataset. This oftentimes looks different for different projects, but here are some common parts of the EDA process:
Starting with Data Cleaning
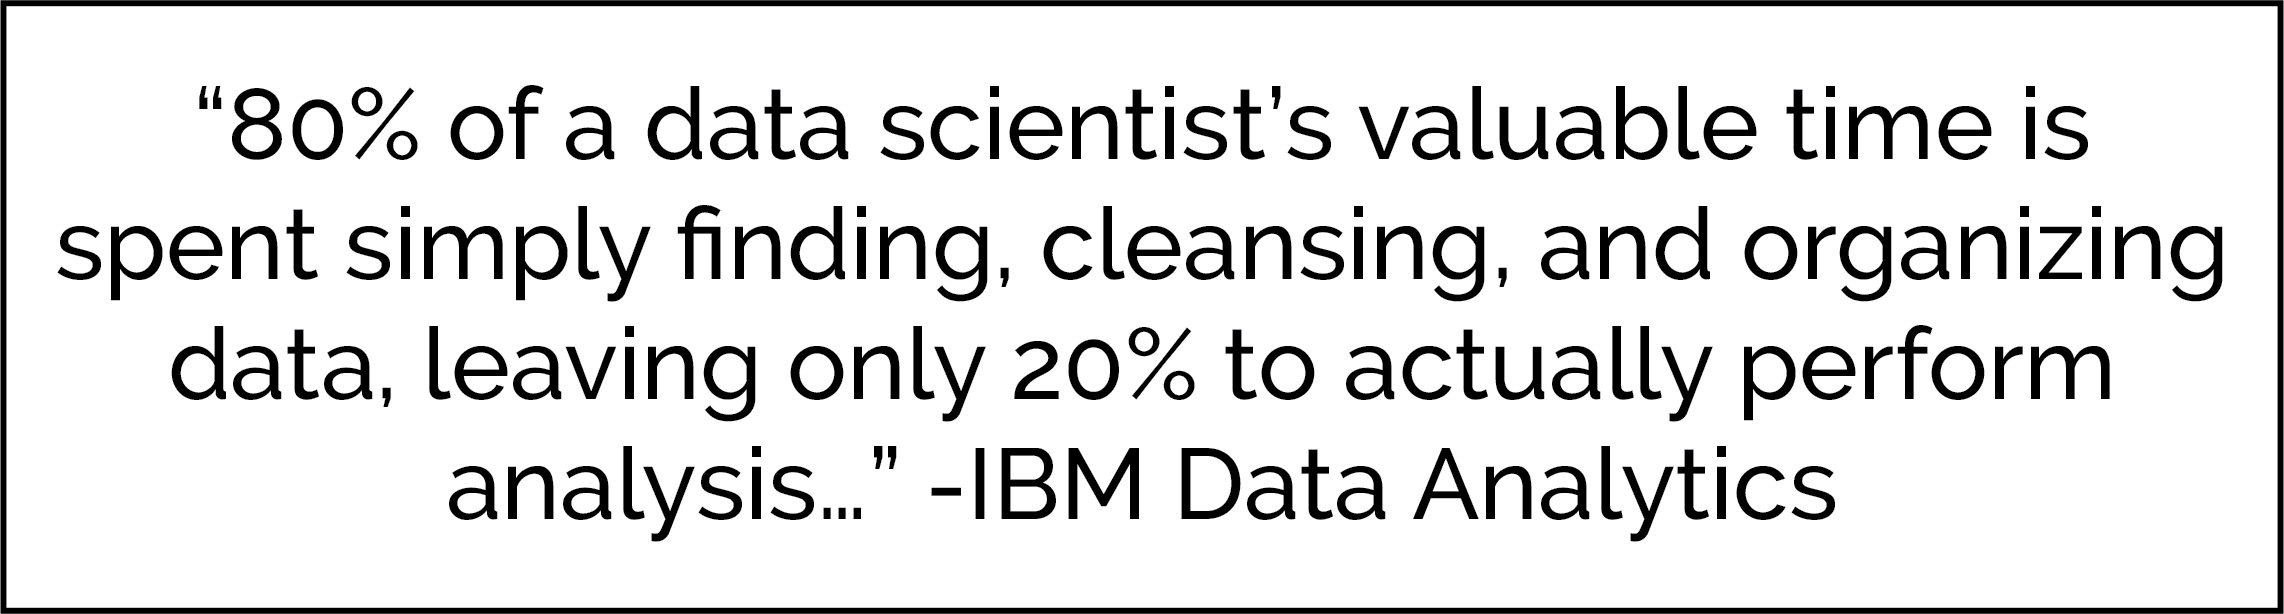
Data cleaning can be a tedious task. At the start of a new project, data scientists are excited to start analyzing their data and performing analysis, but usually the data that they get is an absolute mess!
We can use Python and pandas to help us clean messy data by...
- Seeing how many rows and columns are in a dataset (
df.shape) - Seeing the names of columns (
df.columns.tolist()) - Looking at all the unique values in a column
- Replacing certain values with other values
- Creating new columns
Another way to clean data is to handle missing values. We can use Python to check for missing values in a dataset.
Many statistical libraries cannot handle missing data so you may have to enter a value for the missing data. Often times people use:
- A constant value that has meaning within the domain, such as 0, distinct from all other values
- A value from another randomly selected record
- A mean, median, or mode value for the column
- A value estimated by a predictive model
Simple EDA Techniques
Analysis of Data Types: We can use
df.dtypesto display the data types of each column in your DataFrame. This is important to know because it may affect your analysis.- Example: Performing numeric operations on a string won’t work.
- Example: Performing numeric operations on a string won’t work.
Reading Descriptive Statistics: You can use Python commands like
df.mean()anddf.std()to calculate measures of center and spread for each column.Creating Basic Visualizations: You can also use Python to create simple visualizations such as histograms, box plots, and scatter plots.
Together, all of these techniques will help you explore your data and get familiar with it! There can be other things you may want to do for EDA, but these are a few to get you started :)