Confidence Intervals
We take samples to find out about larger populations! When we take samples of size n from a given population, we can calculate sample statistics. Two common sample statistics are the sample average and the sample percent.
Our sample average or sample percent can be used as estimates for the population average or population percent. But how confident are we that those estimates are correct?
We can use the CLT and the SE to build confidence intervals around our sample averages and sample percents.
What is a Confidence Interval?
Suppose we are interested in computing the average height of 11-year old boys. Since we can't feasibly go and take the height of every 11-year old boy, we instead take a sample of 100 boys and find the average height in this sample. Say we find that in our sample of size 100, the average height turns about to be 48 inches. The big question here is how we can take our sample of size 100 and its results and draw some type of conclusion about the larger population (in this case all 11-year boys).
We know that the average we computed for our small sample is likely going to off from the true population mean by a little bit. However we can say that we're "quite sure" that the actual average is within a certain amount of our sample. Let's say for this example this number is 1 inch. In this case we can say we are "quite sure" that the actual population mean is within 1 inch from 48 (our sample mean), that is to say we are quite sure that the actual population mean is between 47 and 49 inches. But how sure is "quite sure"? Typically researchers use 95% as a probability that their range is accurate.
So we ask for what value of x are we statistically justified in saying "we are 95% sure that the actual average is between 48-x and 48+x inches.
Confidence Intervals help us answer these kind of questions.
We can use the normal curve to answer the question of how confident we are that our estimates are correct because we know the probability histogram for the sample average and sample percent follows the normal curve (this is the Central Limit Theorem or CLT).
Calculating CIs
In general, to find a x% Confidence Interval (where x is the confidence level), we just take what we got in our sample and add/subtract a certain amount of SEs. The amount of SEs is based on the confidence level and can be found using the normal curve.
For example, if we want a 95% Confidence Interval, we would take:
- Our sample statistic ± 1.96 Standard Errors
- We add and subtract 1.96 SEs since 95% of the normal curve is between z = -1.96 and z = 1.96.
In other words, to find a 95% CI for the sample mean, we would take:
- sample mean ± 1.96(SE)
If we were looking at sample percents, we'd replace the sample mean with the sample percent. How many SEs we add and subtract from our sample statistic depends on how confident we are! Here are some a few z-scores for some common confidence levels:
- 95% ---> z = 1.96
- 68% ---> z = 1
- 90% ---> z = 1.65
- 99% ---> z = 2.6
General Form for a CI
x% CI = sample statistic ± z*SE
- your sample statistic can be something like the sample mean (commonly written as x̄) or the sample percent (commonly written as p̂)
- x is the confidence level (how confident you are)
- z is the z-score corresponding to the confidence level (in other words, the confidence level should be the area between the positive and negative version of the z-score)
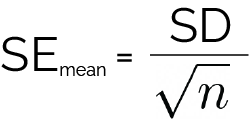
To calculate the SE of the sample mean, use the following formula:
- To calculate the SE of the sample percent, you can take this formula and multiply it by 100% to get it in percent form :)
Confidence Interval Interpretations
Here are two ways to think about the interpretation of a 95% confidence interval for means.
- I am 95% sure that the true population mean lies within my confidence interval.
- If hundreds of people took samples of size n, calculated the mean of their samples, and computed 95% confidence intervals, 95% of those intervals would contain the true population mean.