Hypothesis Testing
Hypothesis Tests (or Significance Tests) are statistical tests to see if a difference we observe is due to chance.
There are many different types of hypothesis tests for different scenarios, but they all have the same basic ideas. Below are the general steps to performing a hypothesis test:
- Formulate your Null and Alternative Hypotheses.
- Ho- Null Hypothesis: The null hypothesis is the hypothesis of no effect. It's the dull, boring hypothesis that says that nothing interesting is going on. If we are trying to test if a difference we observe is due to chance, the null says it is!
- Ha- Alternative Hypothesis: The alternative hypothesis is the opposite of the null. It's what you are trying to test. If we are trying to test if a difference we observe is due to chance, the alternative says it is not!
Think about what you would expect to get if you randomly sampled from the population, assuming the null is true. Compare your observed data and expected data and calculate the test statistic.
Calculate the probability of getting the data you got or something even more extreme if the null were true. This is called the p-value.
Make your conclusion and interpret it in the context of the problem. If p is very low, we say that the data support rejecting the null hypothesis.
How low is "very low"?
The convention is to reject the null when P < 5% (P < 0.05) and call the result “significant”. There’s no particular justification for this value but it’s commonly used.
The P-value cut-off is called the significance level and is often represented by the Greek letter alpha (α).
The One Sample Z Test: One-sided Hypothesis
The first type of hypothesis test we are going to look at is the one-sample z-test. You can do a z-test for means or for proportions. This is the most simple type of hypothesis test and it uses z-scores and the normal curve. Let’s look at one below!
Hypothesis Test Example: Suppose a large university claims that the average ACT score of their incoming freshman class is 30, but we think the University may be inflating their average. To test the University’s claim we take a simple random sample of 50 students and find their average to be only 28.3 with an SD of 4. Perform a hypothesis test to test the claim. Here are the 4 steps:
- Formulate your Null and Alternative Hypotheses.
- Ho- Null Hypothesis: The true average ACT score of all freshman is 30 as claimed.
- This can be written in symbols as well: Ho: μ = 30
- μ is the symbol for the population mean
- Ha- Alternative Hypothesis: The true average ACT score of all freshman is less than 30.
- This can be written in symbols as well: Ha: μ < 30
- Our test statistic for the one sample z test is z! We can calculate z using our z-score formula for random variables since we are dealing with a sample of 50 students.
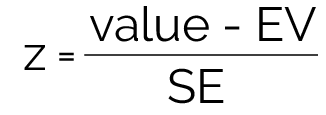
- In our case, the expected value (EV) is 30 since we are assuming our null hypothesis is true (until proven otherwise).
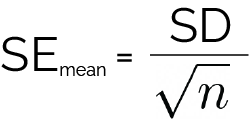
- Since we are dealing with means, our SE is found using the following formula:
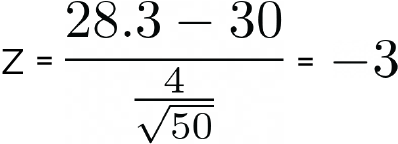
Our z-score is -3. See the calculation below:
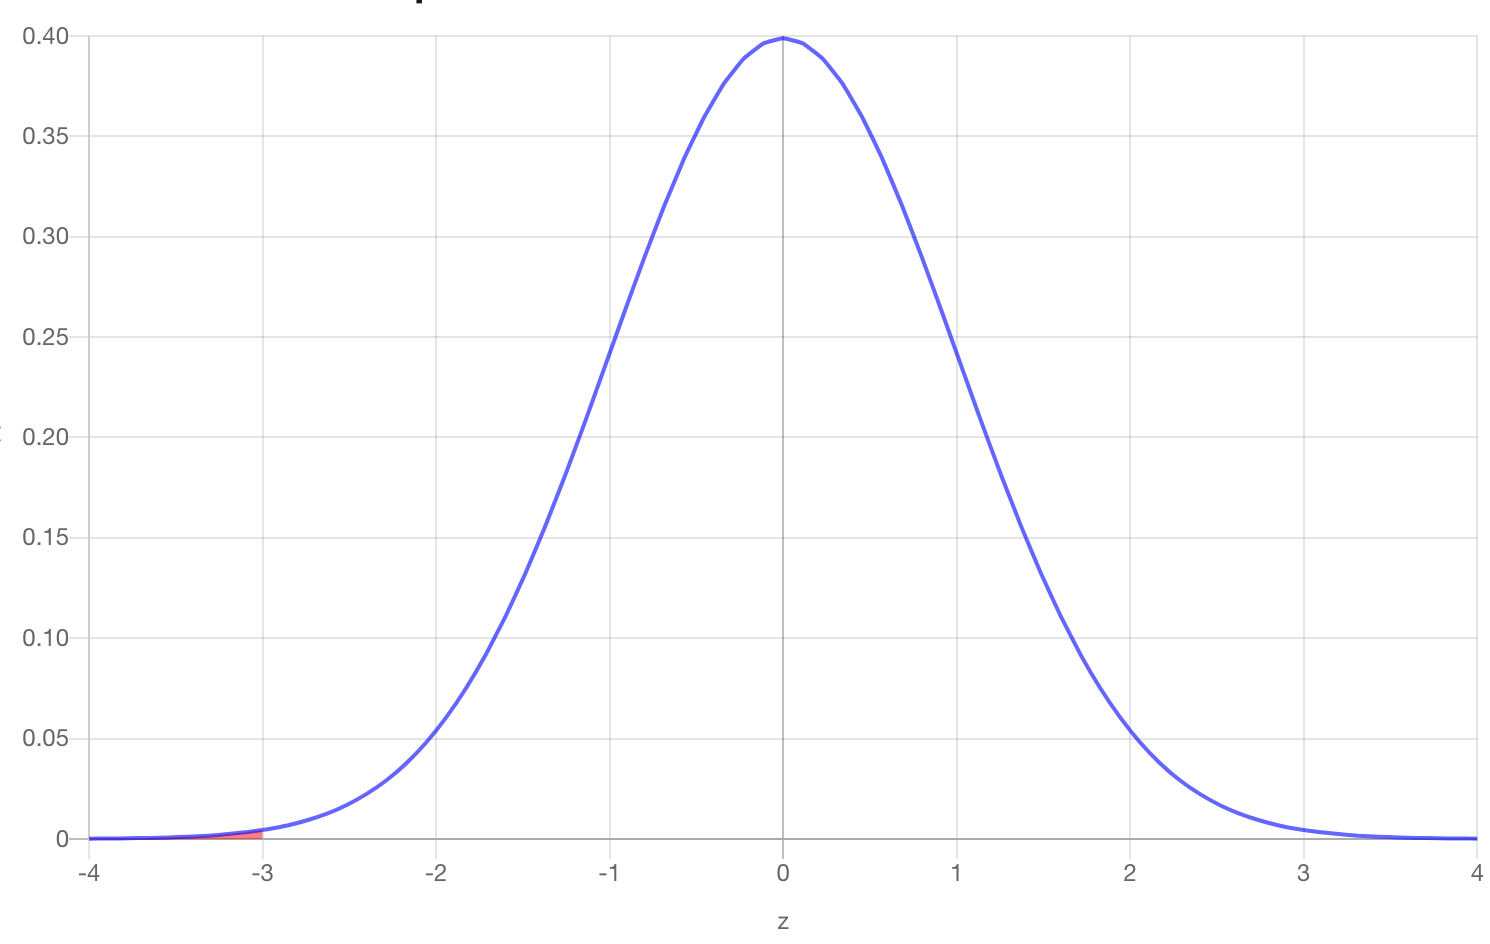
- Calculate the probability of getting the data you got or something even more extreme if the null were true. This is called the p-value. In this case, our p-value is going to be the area to the left of z = -3. We can use Python to calculate this by using
norm.cdf(-3).
- We get that the p-value is 0.0013.
- This is the probability that we would get a sample average of 28.3 given that the null hypothesis was true (the true average was 30).
- Make your conclusion and interpret it in the context of the problem. If p is very low, we say that the data support rejecting the null hypothesis.
- Our p-value is less than 5% so we reject our Null Hypothesis. In other words, there is evidence of the Alternative Hypothesis (that the University is inflating their average).
The One Sample Z Test: Two-sided Hypothesis
Hypothesis Test Example: Now we're going to test the above claim but with a different alternative hypothesis. The large university still claims that the average ACT score of their incoming freshman class is 30, but now we think the University may be inflating or deflating their average. To test the University’s claim we take a simple random sample of 50 students and find their average to be only 28.3 with an SD of 4. Perform a hypothesis test to test the claim with our new alternative hypothesis. Here are the 4 steps:
- Formulate your Null and Alternative Hypotheses.
- Ho- Null Hypothesis: The true average ACT score of all freshman is 30 as claimed.
- This can be written in symbols as well: Ho: μ = 30
- μ is the symbol for the population mean
- Ha- Alternative Hypothesis: The true average ACT score of all freshman is less than 30 or greater than 30.
- This can be written in symbols as well: Ho: μ != 30
Step 2 is the same as the one-sided example, so our z score is still -3.
Calculate the probability of getting the data you got or something even more extreme if the null were true. This is called the p-value. In this case, our p-value is going to be the area to the left or right of z = -3. We can use Python to calculate this by using
2*norm.cdf(-3).
- We get that the p-value is 0.0027.
- This is the probability that we would get a sample average of 28.3 given that the null hypothesis was true (the true average was 30).
- Make your conclusion and interpret it in the context of the problem. If p is very low, we say that the data support rejecting the null hypothesis.
- Our p-value is less than 5% so we reject our Null Hypothesis. In other words, there is evidence of the Alternative Hypothesis (that the University is inflating or deflating their average).