Normal Distribution
The normal curve is a bell-shaped histogram that many histograms resemble.

The standard normal curve is a special normal curve that has an average of 0 and an SD of 1. Here are some facts about the standard normal curve:
- It is bell-shaped.
- It is centered at 0.
- Both the average and the median are 0 and the SD is 1.
- The x-axis is measured in standard units (also called Z scores).
- The area under the curve is 100%.
The Normal Approximation
Many histograms are close to the normal curve.
For these histograms, you can use the standard normal curve to estimate percentages for the data. But first you have to scale the data values to those of the standard normal curve. In other words, you have to change the horizontal scale to have an average of 0 and an SD =1. We do this by converting to standard units.
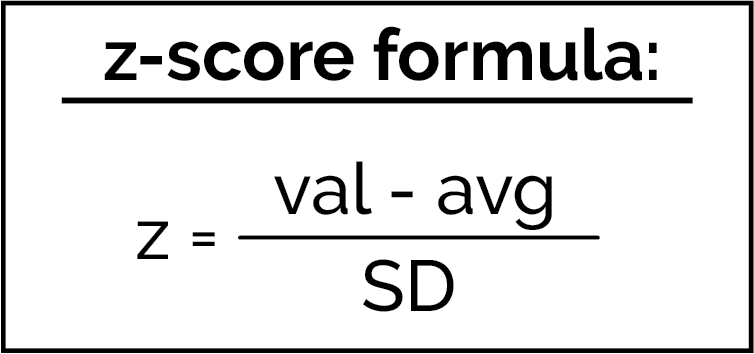
STANDARD UNITS or Z SCORES
Standard Units (also known as z scores) indicate how many standard deviations above or below the average a value is. To use the standard normal curve all data values must be converted to standard units by the following:
It's important to note that we can only use the normal approximation when the data is normally distributed.
The standard normal curve has a nice table attached to it that we can use to answer questions about the data after we convert to z scores. However since we are data scientists, instead of using the table, we can use Python to calculate any area under the standard normal curve.
Distributions in Python
Before we start calculating areas under the standard normal curve, we have to import a library to help us. The scipy library provides access to many different distributions in Python, including the normal distribution. Accessing the distribution requires importing a library:
from scipy.stats import norm
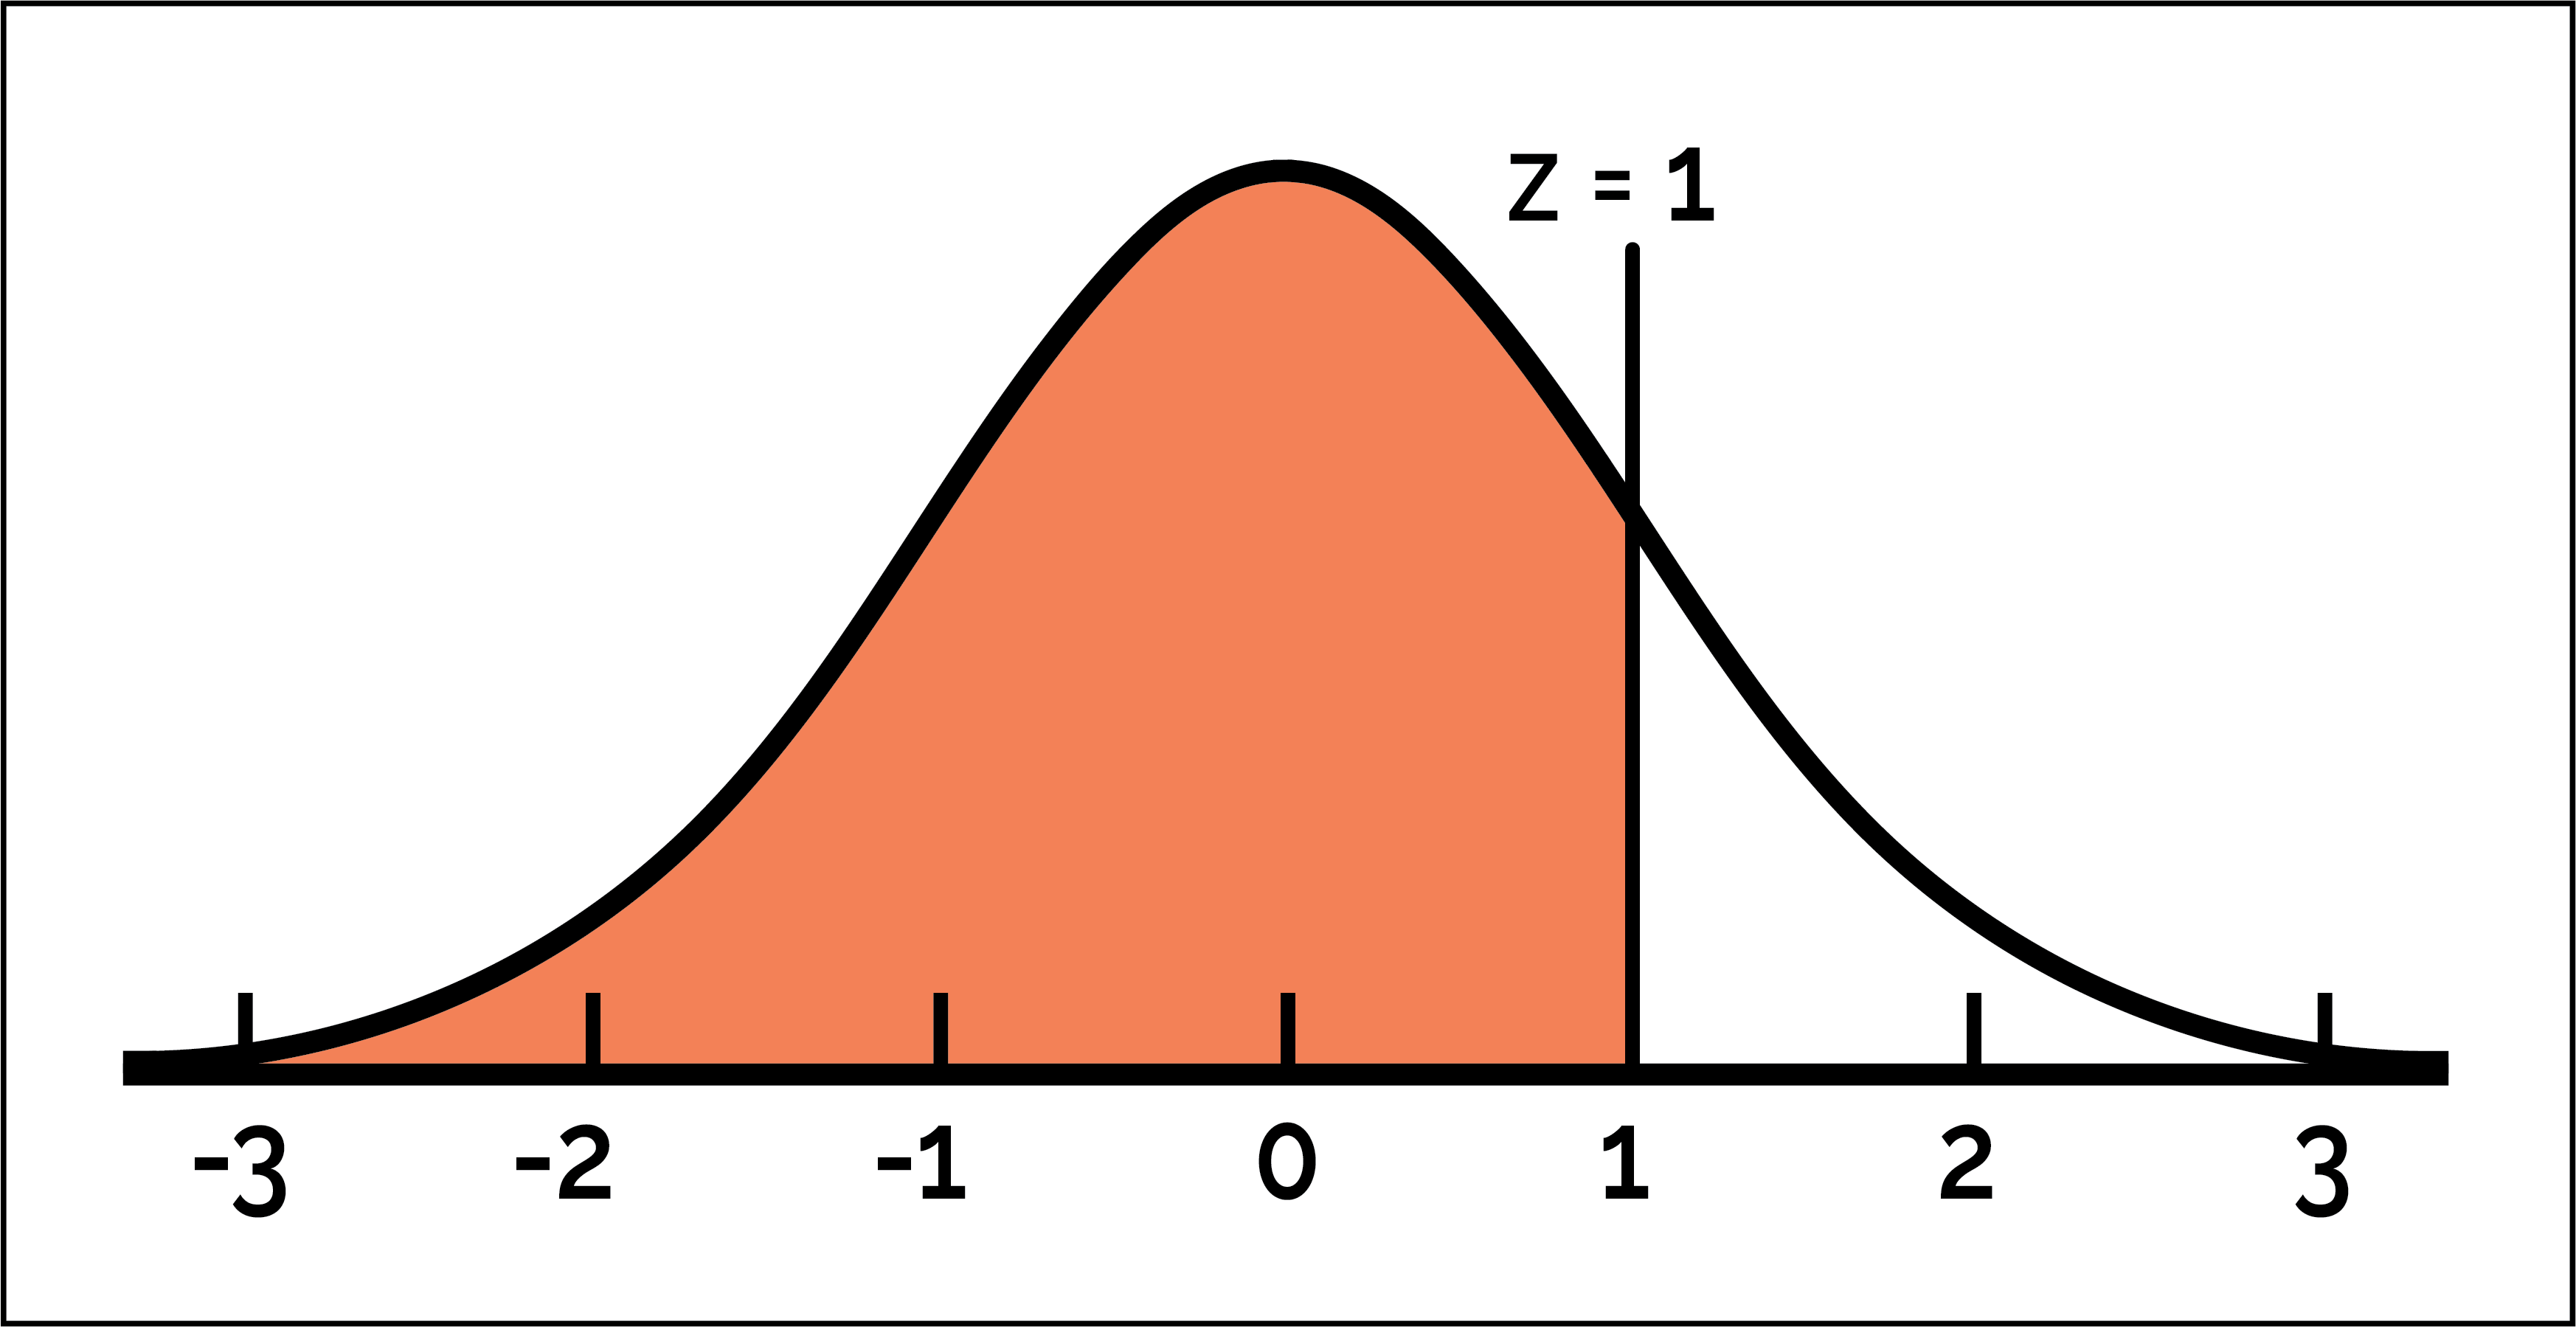
Next, we can use the cdf (cumulative distribution function) to find the area to the left of any z-score. For example, the command norm.cdf(1) will give us the area to the left of the z-score 1.
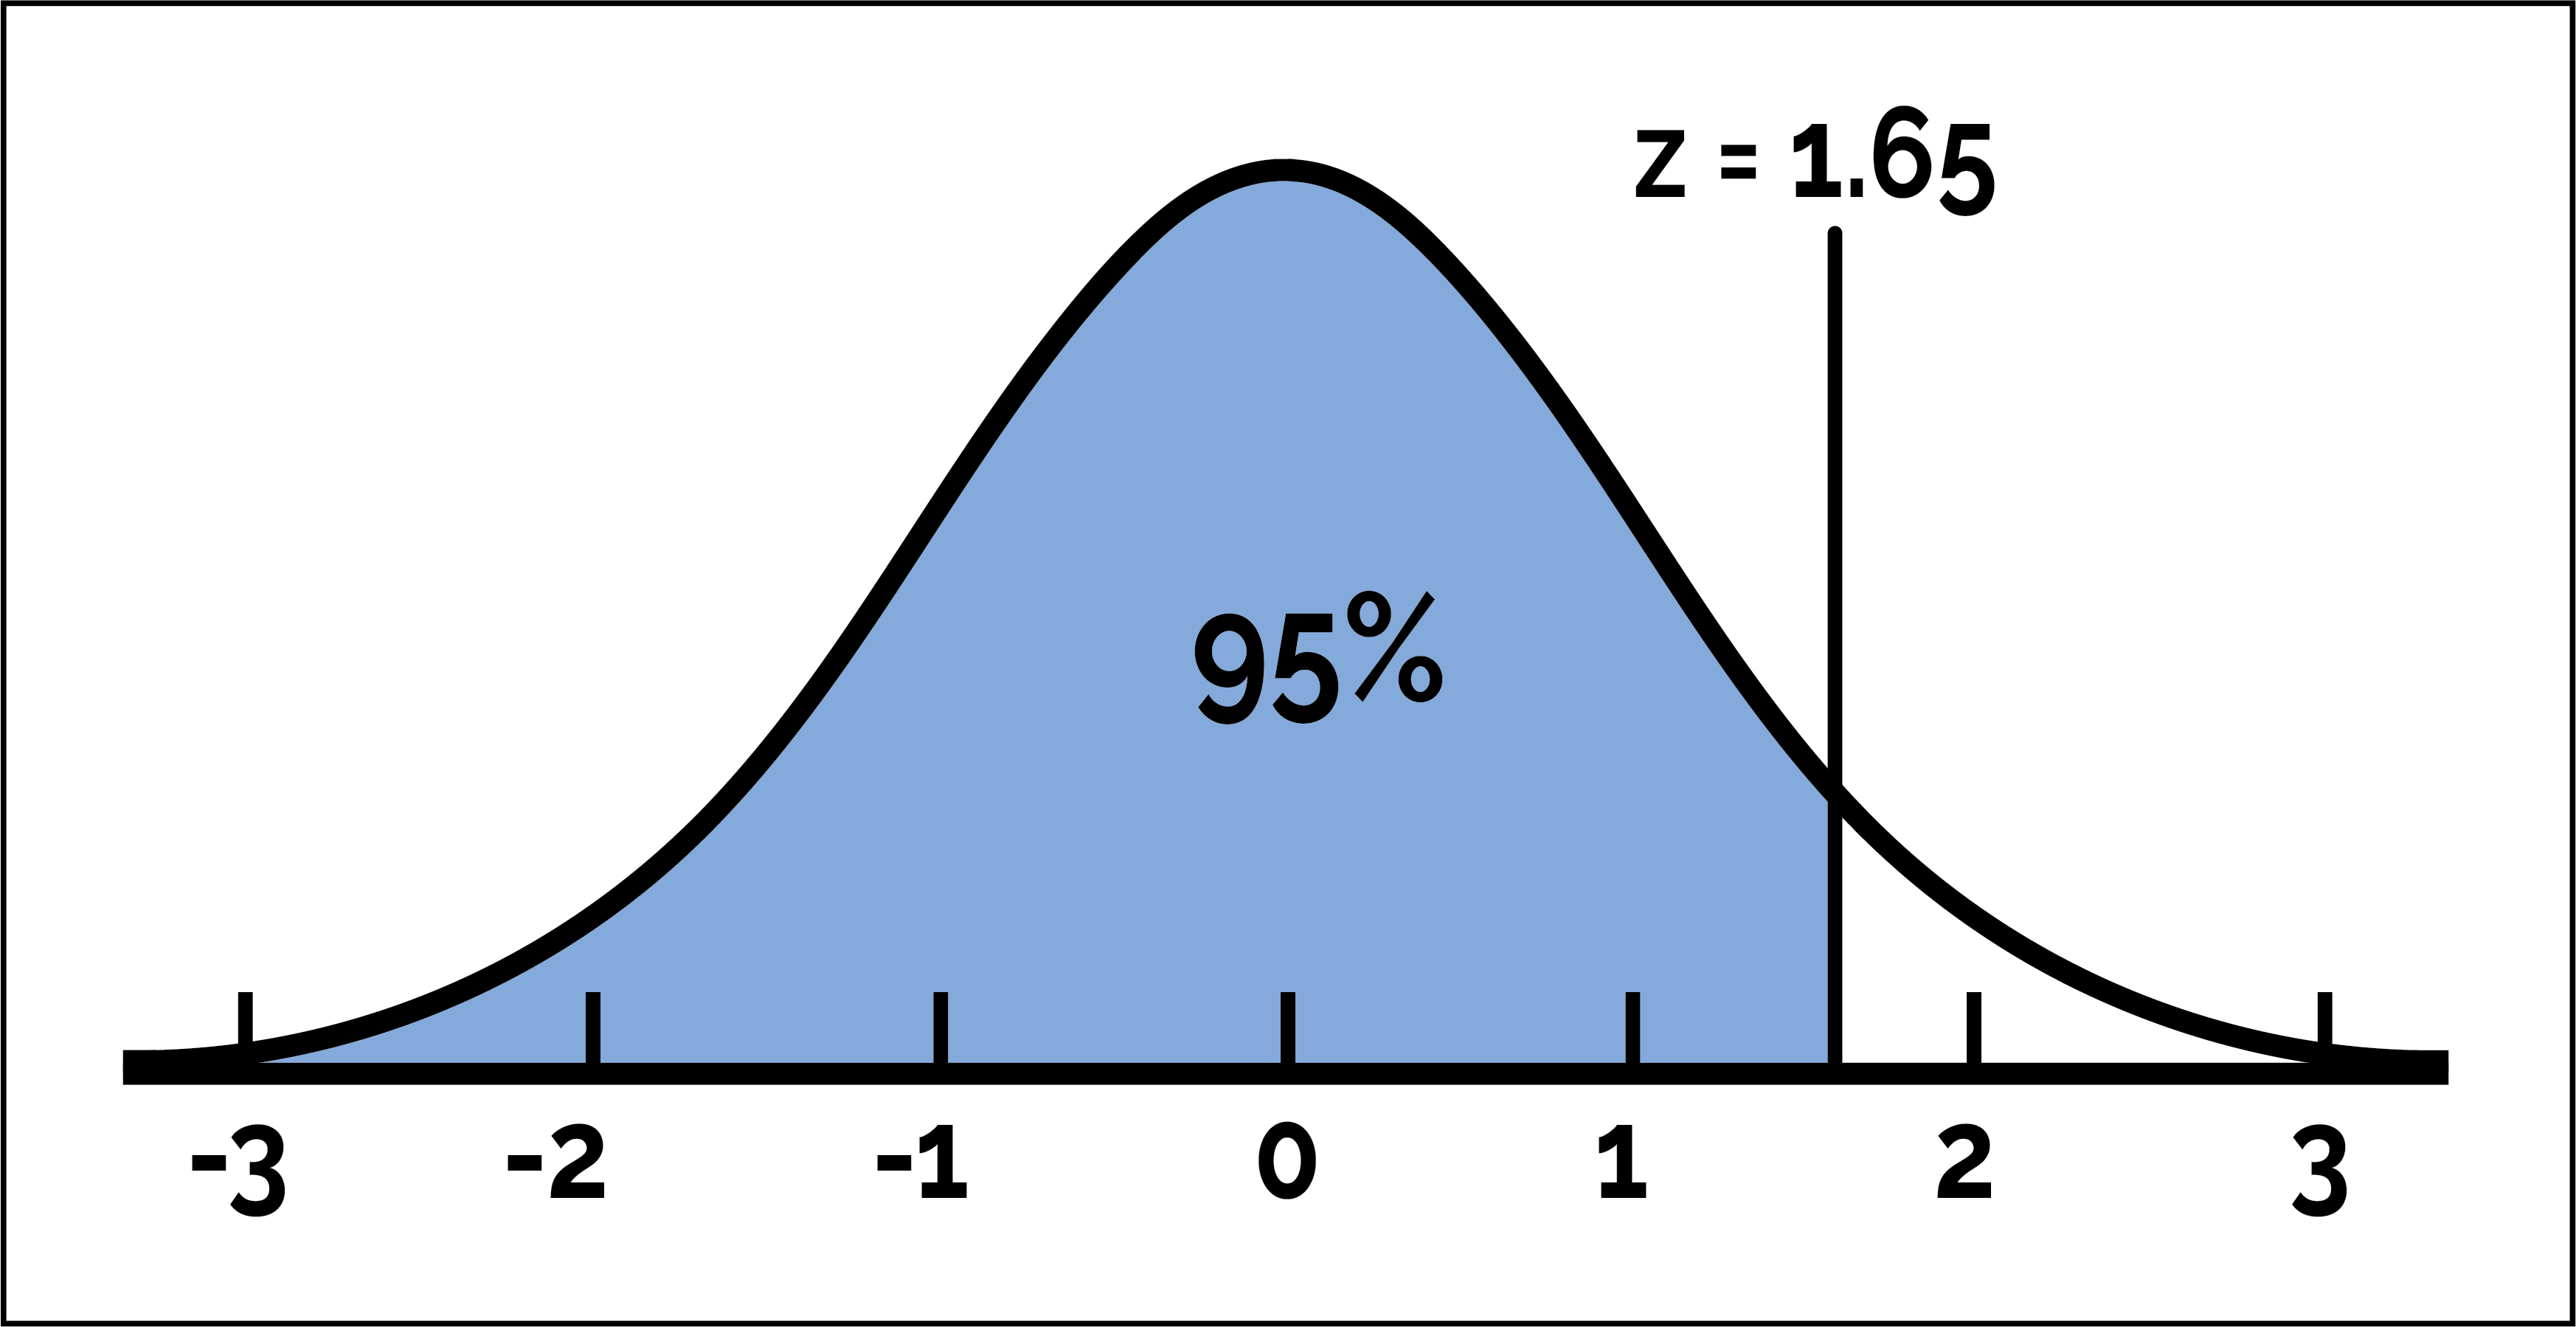
We can also go backwards -- given an area to the left of the z-score, what is that z-score? We can use the probability point function or ppf to do this. For example, the command norm.ppf(.95) gives us the z-score in which the area to the left of it is 95%.
Lastly, knowing that the area under the standard normal curve is always 1 or 100%, we can use the cdf and ppf functions to answer any question about areas under the standard normal curve and z-scores :)