Correlation
Now we are going to look at the linear relationship between two variables! Visually, we can use a scatter plot to show the relationship between two variables (X and Y). The variable on the x-axis is known as the independent variable and the variable on the y-axis is known as the dependent variable.
We can use df.plot.scatter() to create scatter plots in Python.
In addition to looking at two variables graphically, we can also calculate a statistic that mathematically represents the linear relationship between X and Y. We can measure the strength of this linear relationship using the Correlation Coefficient.
CORRELATION COEFFICIENT ( r )
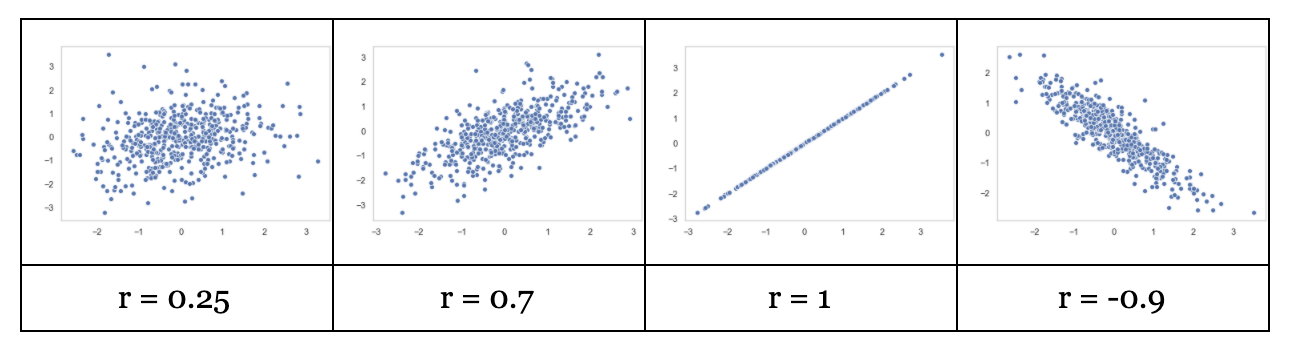
The correlation coefficient (often represented by the letter, r) measures the strength of the linear association between two variables (X and Y). It measures how tightly points are clustered around a line. It is relevant when the scatter plot forms a linear trend.
The correlation coefficient is always between –1 and 1.
The closer the points hug a line with a positive slope, the closer r is to +1. The closer the points hug a line with a negative slope the closer r is to -1.
If there is no association between x and y then the correlation coefficient is 0 and the scatter plot has no linear pattern.
In other words,
- A correlation of 1 or -1 means you can perfectly predict one variable knowing the other.
- A correlation of 0 means that knowing one variable gives you no information about the other.
Here are some examples below:
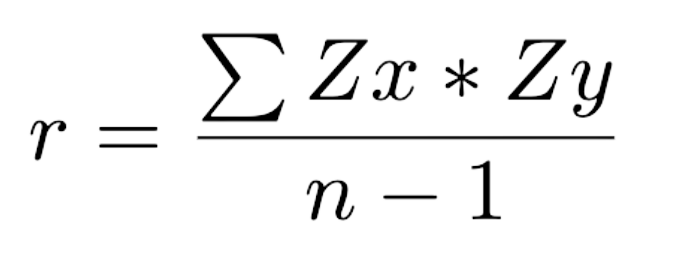
How to mathematically calculate the correlation coefficient:
In words:
- Convert x-values and y-values to standard units (z-scores). Z-scores tell you how many SDs a value is above or below average.
- Multiply each x-value (in standard units) by each corresponding y-value (in standard units)
- The correlation coefficient is the sum of the products divided by n-1.
In symbols:
Correlation in Python
In Python, the following code will display the correlation coefficient for every numeric column (variable) in a DataFrame:
df.corr()
The output is called a correlation matrix. Finding the correlation matrix can be an important part of Exploratory Data Analysis to see if there are any linear relationships between two variables!