Simple Linear Regression
Linear Regression
The idea of trying to fit a line as closely as possible to as many points as possible is known as linear regression. The most common technique is to try to fit a line that minimizes the squared distance to each of those points. This is called OLS or Ordinary Least Squares Regression.
We can find the equation of this line and use it to make predictions. Since our regression estimates form a straight line, we can describe them using an equation in slope-intercept form:
Regression Equation

When we have one x-variable (x1) and one y-variable (y-hat), this is called simple linear regression. This means that we are using one independent variable to predict the y-variable. We can have multiple independent variables to predict the y-variable and this is called multiple regression. For now, we are going to focus on simple linear regression because it's easy to interpret the results.
The Slope and Y Intercept of the Regression Line
In our regression equation, b0 is the y-intercept and b1 is the slope. Here's how you calculate the slope and y-intercept:

Here's how you interpret them:
- SLOPE= The average increase in Y associated with a 1-unit increase in X.
- Y-INTERCEPT= The predicted value of Y when X is equal to 0.
In order to make predictions using the equation of the regression line, first find the slope and y-intercept. Next, you can plug in values of x to get predicted values of y.
Warning About Regression
When making predictions using regression, it's important to be aware of the following:
- Predicting y at values of x beyond the range of x in the data is called extrapolation.
- This is risky because we have no evidence to believe that the association between x and y remains linear for unseen values of x.
- Extrapolated predictions can be absolutely wrong.
Residuals and RMSE
Unless there is a perfect correlation, our predictions are not going to be perfect. When thinking about this graphically, this means that for most of the points in any scatter plot, the actual y-values and the predicted y-values are different. The distance between the actual value and the predicted value from the line is called the residual or prediction error.
The residual is calculated by taking the actual value of y - the predicted value of y.
The residuals are the vertical distances between the points and the line.
- If the point is above the regression line, the residual is positive.
- If the point is below the regression line, the residual is negative.
- If the point is exactly on the regression line, the residual is 0.
Two Key Features of the Regression Line:
- For any regression line, the average (and the sum) of the errors is always zero because the positives and negatives cancel out.
- The SD of the errors (also called the Root Mean Square Error or RMSE), is a measure of the typical spread of the data around the regression line.
RMSE=SDerrors: The SD of the prediction errors is a measure of how accurate our predictions are. The better the predictions, the smaller the size of the errors and the smaller the RMSE.
Rather than finding all the errors and then taking their root mean square, it's much easier to use this formula below. The RMSE is in the same units as your y variable.

Example Walk-Throughs with Worksheets
Video 1: Cumulative Distribution Function (CDF) in Python
Video 2: Cumulative Distribution Function (CDF) in Python
Video 3: Probability Point Function (PPF) in Python
Video 4: Probability Mass and Density Functions (PMF/PDF) in Python
Video 5: Random Variable Sample (RVS) in Python
Video 6: Summary of Functions on Distributions in Python
Practice Questions
Q1: Which one is better?Q2:

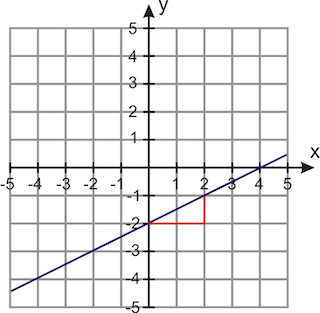
What is the Y-INTERCEPT for the given straight line?
Q3: Suppose we have clinical data for 400 patients and the task is to predict if a patient has cancer from the given data. Should we use linear regression in this situation?