#13: Choropleth Maps
Project Overview
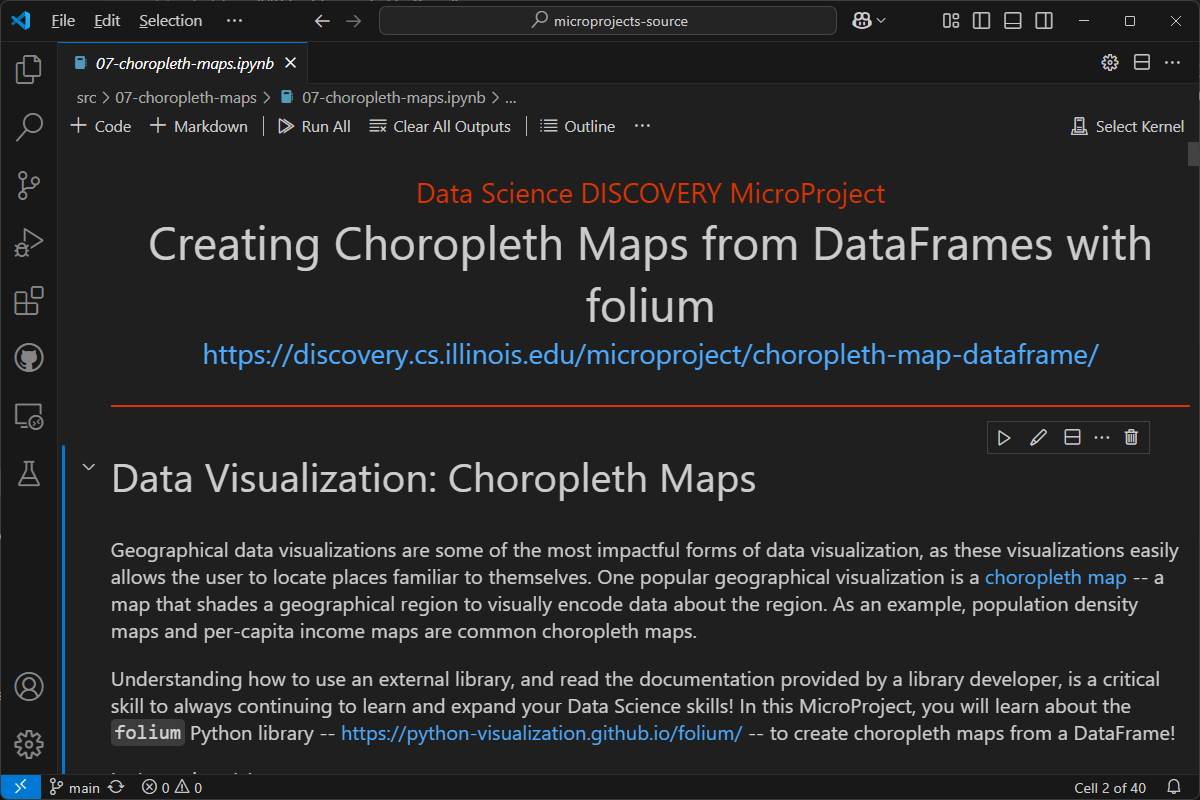
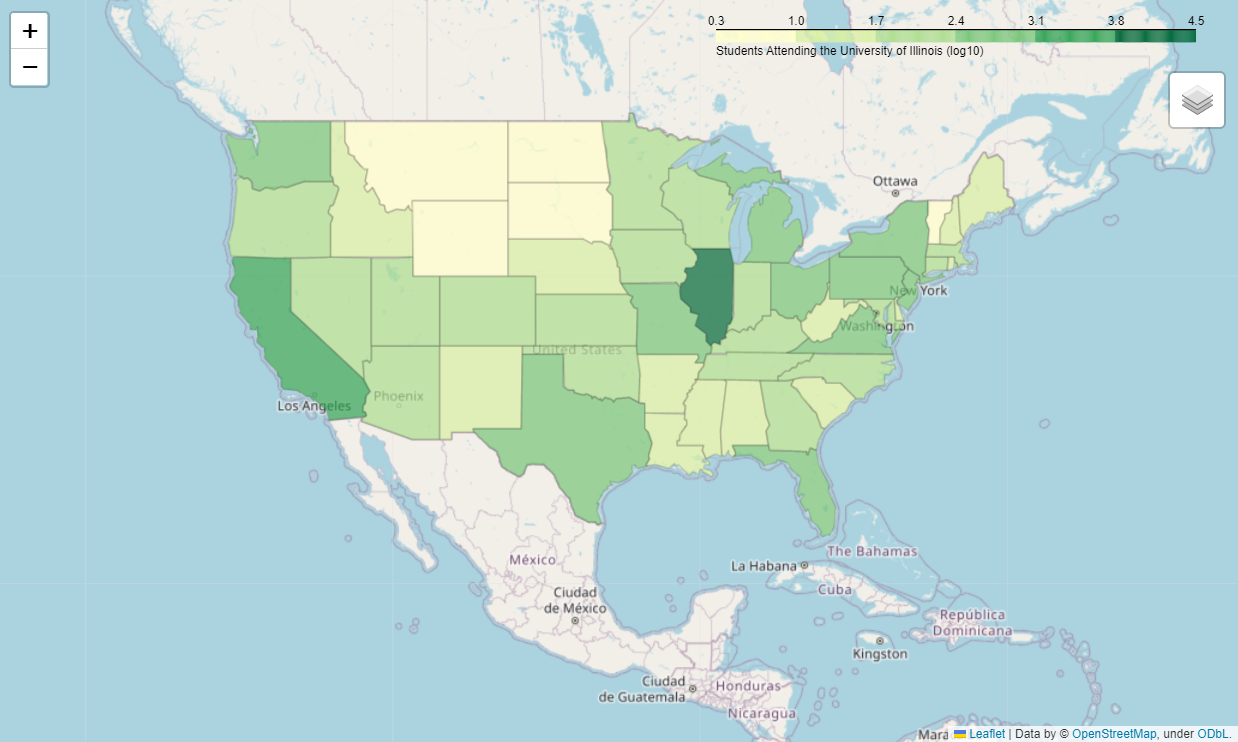
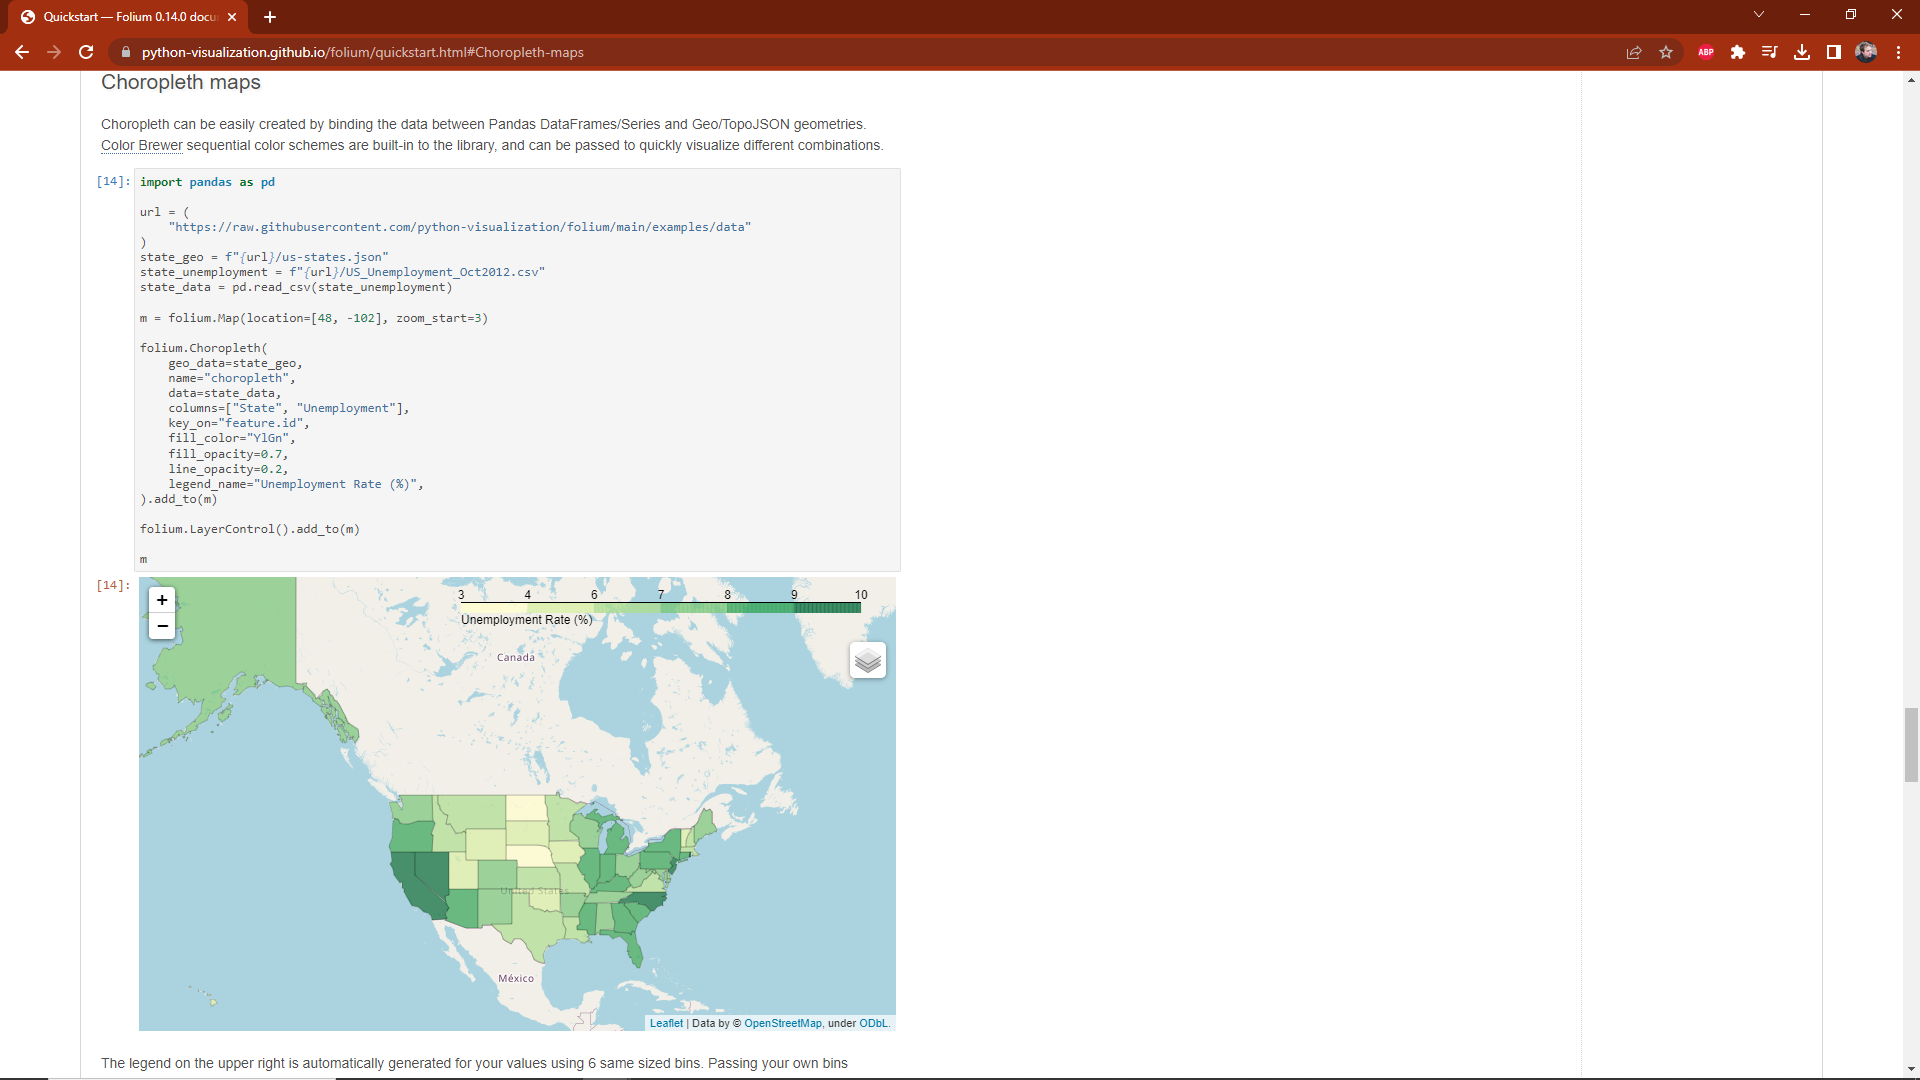
Geographical data visualizations are some of the most impactful forms of data visualization, as these visualizations easily allows the user to locate places familiar to themselves. One popular geographical visualization is a choropleth map -- a map that shades a geographical region to visually encode data about the region. As an example, population density maps and per-capita income maps are common choropleth maps.
Understanding how to use an external library, and read the documentation provided by a library developer, is a critical skill to always continuing to learn and expand your Data Science skills! In this project, you will learn about the folium Python library -- https://python-visualization.github.io/folium/ -- to create choropleth maps from a DataFrame!
Let's nerd out! :)
Upgrade Incoming!
We are upgrading this project from our older MicroProject format to a DISCOVERY Data Science Project! 🎉
- This project will be available as soon as possible!
Video Walkthrough
Project Preview
Legacy Access
In your terminal, navigate to your GitHub repository and merge the initial files by running the following commands:
git fetch microprojects
git merge microprojects/microproject-13-choropleth-maps --allow-unrelated-histories -m "Merging initial files"
Complete the Notebook
If the commands above were successful, you have merged in the initial files to start on the MicroProject.
- Find the new
microproject-13-choropleth-mapsfolder. - Open
microproject-13-choropleth-maps.ipynband complete the MicroProject!
Commit and Grade Your Notebook
Once you have finished your notebook, you must use the built-in GitHub Action to preform automated grading of your MicroProject notebook! You will need to commit your work and then manually run the GitHub Action.
Commit Your Work
To commit your notebook, run the standard git commands in your terminal:
git add -u
git commit -m "microproject completed"
git push
Grade Your Notebook
To grade your notebook, you will need to visit your GitHub repository in your browser.
- Visit your GitHub repository in your browser
- Click on the "Actions" tab
- Under "Workflows", find the workflow for this microproject
- Click the "Run Workflow" in the blue box, and then the green "Run Workflow"
- After about 10 seconds, you should see a new job that has started running
- You can click on the job to watch it run in real-time
- It will take ~1 minute to run and grade
- Once the running is complete, the autograding summary will be available!