Project #12: Building a Scene Recognition Model from Video Frames
In this DISCOVERY Data Science Project, you will do real data science in less than an hour and you will earn this project's card to your collection when you fully complete this project! 🎉
Data Source: Frames of a Video
In Project #7 and #8, you already saw that images are an important part of Data Science as a source of data. In this project, you will create your own simple machine learning classifier to detect the amount of time spent in different "scenes" we used when creating office-hour style videos for Data Science DISCOVERY.
We have completed a screen capture from the DISCOVERY YouTube video "Outliers Impact on Correlation (m6-02b)" that was used as part of our DISCOVERY lecture covering Correlation. We captured one video frame every second and stored it as an image, and those files are available for you as a series of frames:
Using these images, you will be building a human-designed classifier that will be able to predict the classification of unknown future data (ex: all of the other videos!). Let's nerd out! 🎉
Part 1: Loading a Video Frame
To analyze these images, the skimage library is commonly used to load image data into Python. Specifically the skimage.io.imread(filename) will read a filename and return the pixel color for every pixel in the image.
To use the imread function, you will need to either do one of the following:
- Either import all of
skimageby using the import lineimport skimage. After importing all ofskimage, you will call the function using its fully qualified name:skimage.io.imread(filename).
OR
- Import only the
imreadfunction by using the import linefrom skimage.io import imread. After importing onlyimread, you will call the function directly:imread(filename)
Part 1.1: Read Pixel Data for frame_0001.jpg
In the following cell, store the pixel color data from the file named frame_0001.jpg in the variable pixels by using the imread function:
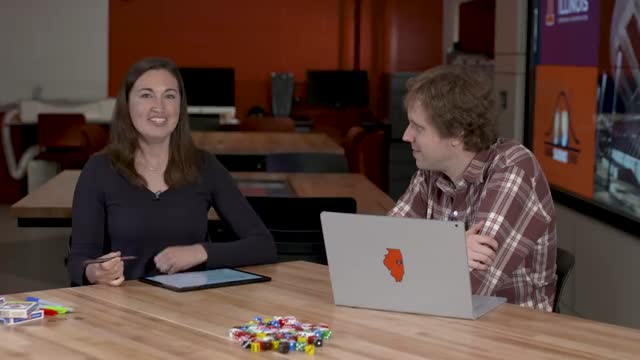
Here's the image you loaded into pixels for reference as we work on the next section:
⚙️ Test Case: Part 1: Loading a Video Frame
Part 2: Finding Average Image Colors
The shape of your data is the rows by columns by color values as 3-dimensional list. Here's a formatted view of your pixels data:
[
  [ [91, 83, 80], [91, 83, 80], [91, 83, 80] ], ... ],   # Row #1
  [ [91, 83, 80], [91, 83, 80], [91, 83, 80] ], ... ],   # Row #2
  ...                                                    # ...
]
The current shape of pixels is 360 rows by 640 columns by 3 colors. Each of the three colors represent the three color channels on a screen: red, green, and blue.
Using pixel.mean(), we find the average color by grouping ALL the color channels (combining blues and reds and greens together). Try it out:
We can also find the average of each color channel instead of grouping them all together. The pixels.reshape(-1, 3).mean(axis=0) function will return the mean of each color channel across all pixels. Check out the new mean output:
We can combine it with .mean(axis=0) to find the average color of the three color channels:
Finally, when a list or array is returned, we can spread the values into different variables where each variable takes one value from the list. For example:
# Spreads the [2, 4], so x=2, and y=4:
x, y = [2, 4]
We can spread any size list into as many variables as elements in the list:
# Spreads a list of five elements into five variables:
a, b, c, d, e = [20, 30, 40, 50, 60]
# a = 20; b = 30; c = 40; d = 50; and e = 60.
This can be helpful for the average pixel colors of an image:
# Spreads the list of three color channels into r, g, and, b:
r, g, b = pixels.reshape(-1, 3).mean(axis=0)
Part 2.1: Finding the Average Color of One Image
Store pixels's average red value in r, average green value in g, and average blue value in b:
⚙️ Test Case: Part 2.1: Finding the Average Color of One Image
Part 2.2: Finding the Average Color of All Images
The following code loops through every file in the frames directory -- this will include frame_0001.jpg (like you analyzed already) and also frame_0002.jpg, frame_0003.jpg, and all 300+ frames!
Create a DataFrame named df where each row is one frame with the following four columns:
frame, the filename of the framer, the average red color of the frameg, the average green color of the frameb, the average blue color of the frame
The structure of the code should be nearly identical to writing a simulation. Instead of creating random variables for your real world data, your real world data will be the filename, and the average color values.
- See: https://discovery.cs.illinois.edu/learn/Simulation-and-Distributions/Simple-Simulations-in-Python/
(Hint: Start at the very beginning of this project and observe the steps taken to get the average colors of frame_0001.jpg.)
⚙️ Test Case: Part 2.2: Finding the Average Color of All Images
Part 3: Create a Simple Classifier
In the DISCOVERY lecture videos, there are two primary "scenes" in the video:
"Office Hours Studio Scene", where Karle and Wade are talking to each other and the audience
"Notebook Scene", where the notebook is displayed
Open the image explorer and find at least three more frames that are in the "Office Hours Studio Scene" and at least three more frames that are in the "Notebook Scene". Add the frame numbers you found to the lists below:
⚙️ Test Case: Frame Selection
Part 3.1: Observing the Average Colors of Your Frames
To help you with the rest of this project, run the next two cells to view the r, g, and b values for the office hour and notebook frames you selected above:
Part 3.2: Create Your Classifier Function
A classifier function is a function that takes data and gives a classification for that data. Create a new function, classifyFrame that receives an r, g, and b value.
Using information from your frames above, have the function return the string "office hour" or "notebook" based on the values of r, g, and b. To do this, try to observe general trends in the color values for both kinds of frames.
IMPORTANT: Make sure your classifier can handle ANY input -- even frames you have not seen before! For example, you might decide that you will call a frame an "notebook" frame if the sum of r, g and b is greater than some value and otherwise it's a "office hour" scene.
Here's a function to test your classifier to make sure your function returns a valid result (feel free to edit this).
- Right now, focus on making sure your function returns a valid result (either
notebookoroffice hour) - In the next part, we'll work on making sure it is an accurate classifier.
⚙️ Test Case: Part 3.2: Create Your Classifier Function
Part 4: Using Your Classifier!
Now that we have a classifier, we should run it on every frame and see if your classifier correctly classifies scenes in the video frames.
The following cell runs your classifyFrame classifier on every frame and adds a new column scene. Then, 20 random rows are displayed below. This output can be checked against the actual images.
- You should see a mix of
office hourandnotebookvalues in your scene column. - If your classifier is not correct, update your
classifyFramefunction in the previous section and re-run that cell, and then re-run this cell to use your updatedclassifyFramefunction.
Observing Your Results
In the next four cells, we display a frame and you'll run code to check what your classifier classified the frame as being! Make sure to run the code for each frame.
- If your classifier is not producing the correct classification, you will need to update your
classifyFramefunction and re-run both theclassifyFramecell and the cell at the top of this section to generate a new scene classification for each image. - It may take several attempts to get this correct, building an AI can be difficult!
Frame #0001: Office Hours
Frame #0081: Notebook
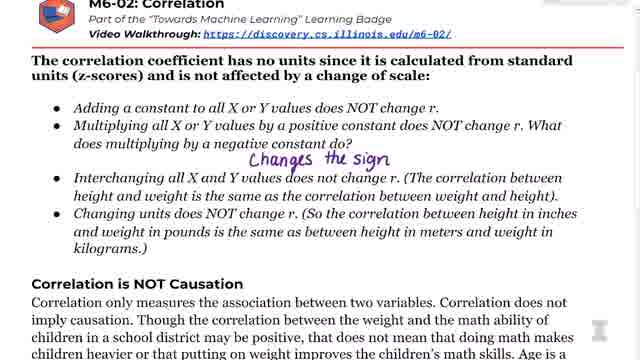
Frame #0191: Notebook
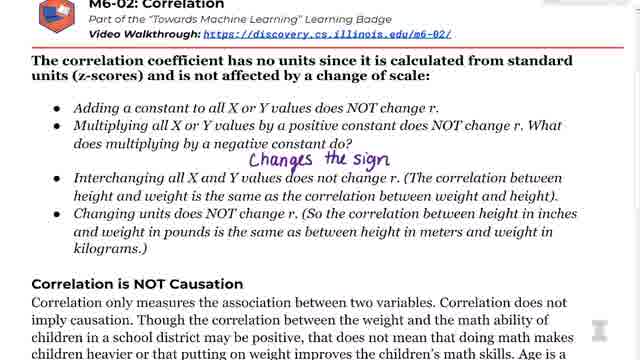
Frame #0306: Office Hours
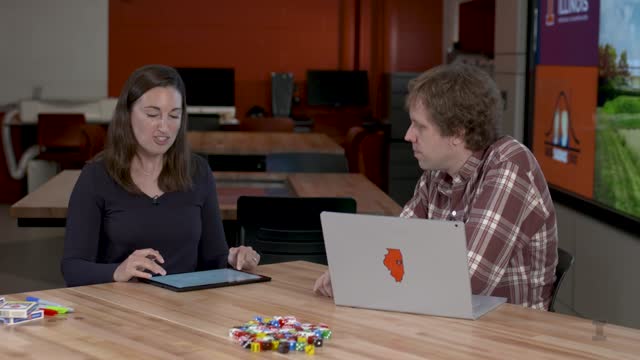
Run the "Part 4" Test Case:
⚙️ Test Case: Part 4: Using Your Classifier
Part 5: Improve Your Classifier
There are some frames that are neither the office hour nor the notebook. How did your classifier do...?
Run the following cells to see how you classified some unexpected frames:
Frame #0320: Data Science Duo Logo???
What did you classify the DUO logo as? It's neither one, but we don't have that option!

Frame #0328: Video Credits
What did you classify the video credits as? It's another tricky one!

Part 5.1: Building a Second Classifier
Create a second classifier classifyFrame2 that returns either "notebook", "office hour" or "other". Your classifier should correctly handle the "Data Science Duo" (ex: #0320) frames and the "Credit" frames (ex: #0328).
- Think of what might uniquely identify these two special frames that is different than the office hour or notebook scenes. The average color values displayed with the images above may help you with some ideas.
- You must still correctly classify
"notebook"and"office hour"frames, in addition to classifying"other"frames - Hint: It may be helpful to first identify if it's an
"other"since these scenes may be most distinctive.
Part 5.2: Apply your classifyFrame2 function
Using classifyFrame2, this code replaces the value in the column scene with your classifyFrame2 classification function. The output of this cell shows the last frames of the video, which we expect many of the results to be "other":
Test Cases
You can re-run the sample image cells earlier in this notebook after running the code in Part 5.2 since we updated the DataFrame using your new classifier. Remember to update classifyFrame2 to update your new classifier (not the original one).
⚙️ Test Case: Part 5: Update Your Classifier to Account with an Other Category
Part 6: Training a K-Means Clustering Classifier
Could this have been done with AI? Let's see how well K-Means would have done!
- Train a four-centroid KMeans classifier, similar to what you did in Project #11, using the entire dataset with the independent variables
r,g, andb. - With your trained model, add a new column named
clusterto your DataFrame that stores the cluster that each frame belongs to in the fitted KMeans model. - To ensure that our model always predicts the same cluster so we can debug our human-created model (you normally wouldn't want to do this), we'll manually specific initial conditions of our KMeans model using
1867(the year the University of Illinois was founded!).
⚙️ Test Case: Part 6: Train a KMeans Classifier
Viewing the Content of Each Cluster
In the cells below, we've provided the code to view a random sample of rows from each cluster. Observe each cluster to see if each cluster uniquely identifies frames from a single scene:
Labeling the Scene in Each Cluster
As an unsupervised model, KMeans identified sets of images that are similar. However, KMeans is unable to identify what scene is contained in each cluster. To be able to compare the accuracy of your hand-made classifier with KMeans, we need your help to identify the clusters.
Using the output in the four cells above, complete the cells below to identify the scene the cluster's images show:
- Each cluster will either be the scene
"office hour","notebook", or"other". It is okay if two clusters are the same scene. - (If you see a mix of multiple labels, you can run the code to get a new sample to best identify what scene the cluster primarily contains.)
⚙️ Test Case: Labeling the Scene in Each Cluster
Part 7: Comparing Model Error
How did the models do? Run the following cell to see if you or KMeans did better!
Analysis of Model Error
Taking a look at your two models:
- Which model performed better?
- To you, was it surprising that KMeans was able to learn the scenes of an unknown set of images?
We hope this project provides you a bit of insight on how well even simple models can do are fairly complex tasks!
Validate and Complete This Project!
Congratulations on finishing this DISCOVERY Data Science Project! 🎉🎉
To validate your entire project, your entire code will run from top-to-bottom on this page and each test case will be validated one final time. If everything looks good, you'll earn the card for completing this project: